
Translate this page into:
Differential expression of cancer stem cell markers and pro-inflammatory cytokine IL-1β in the oral squamous cell carcinoma and oral submucosal fibrosis
Address for correspondence: Dr. Ausaf Ahmad, Amity Institute of Biotechnology, Amity University, Lucknow, Uttar Pradesh - 226 028, India. E-mail: aahmad@lko.amity.edu
This is an open-access article distributed under the terms of the Creative Commons Attribution-Noncommercial-Share Alike 3.0 Unported, which permits unrestricted use, distribution, and reproduction in any medium, provided the original work is properly cited.
This article was originally published by Qassim Uninversity and was migrated to Scientific Scholar after the change of Publisher.
Abstract
ABSTRACT
Objectives:
The poor prognosis of oral squamous cell carcinoma (OSCC) is vastly due to late diagnosis. The oral submucosal fibrosis (OSMF) is often unnoticed pathology linked with high risk of malignancy. Recently, we demonstrated that the clinicopathological alterations in OSMF and OSCC patients were correlated with cancer stem cell (CSCs) markers (CD133 and CD44). However, the parallel alterations of interleukin-1 beta (IL-1β) with CSCs expression are largely unexplored. Thus, we aimed to investigate the relationship between IL-1β alterations and CSC marker expression in both OSMF and OSCC situations.
Materials and Methods:
A total of 135 people have signed up for the study. There were sixty each in OSMF and OSCC groups, as well as 15 healthy controls. Levels of serum IL-1β were examined by ELISA. Immunohistochemistry (IHC) was used to examine the expression of CD133 and CD44. For evaluating differential CSCs expression, IHC scoring (0–4) was utilized.
Results:
The IHC results showed maximum subjects in the OSMF and OSCC displaying CD44 and CD133 positivity, although the extent of expression in terms of IHC scoring found variable. CD133 and CD44-positive subjects showed increased levels of IL-1β in the OSMF and OSCC group. Nevertheless, the enhancement of IL-1β is more pronounced in the OSCC cases. Further, we observed a direct link of IL-1β levels with IHC scoring. Multivariate regression analysis demonstrated a significant role for CD44 and CD133 positivity in the increase of IL-1β levels.
Conclusion:
We concluded that concurrent simultaneous changes in CSC biomarkers and IL-1β may help with early detection of OSMF and OSCC conditions.
Keywords
Cancer stem cells
CD133
CD44
IL-1β
oral lesions
OSCC
OSMF

Introduction
A subtype of head-and-neck cancers that primarily start in the mouth is called oral cancer. They comprise cancers of the mouth and/or the back portion of the throat and generally develop on the tongue and/or the tissue lining of the mouth and gums.[1] Globally, oral cancer is the sixth most common type of cancer. India contributes to nearly one-third of the total burden of oral cancer incidences.[2] The most frequent histology, oral squamous cell carcinoma (OSCC), accounts for about 90% of oral cancer cases.[3,4] Oral submucosal fibrosis (OSMF) is an ongoing often unnoticed pathology linked with high risk of malignancy, generally identified as a pre-cancerous condition. Malignant conversion of OSMF to OSCC has been examined to be between 2 and 8%.[3,4] The other common types of oral lesions include leukoplakia, erythroplakia and oral lichen planus having variable potential of malignant transformation.[3,4]
Chewing tobacco (such as gutkha, khaini, and zarda), smoking, pan masala (non-tobacco plain masala, betel quid, supari, etc.), heavy alcohol use, nutritional deficits, bad oral hygiene, and persistent viral infections, especially those caused by the human papillomavirus, are the main risk factors for oral cancer.[2,5] Inflammation also played an important role in tumorigenesis and may cause oral malignancy.[6]
A number of factors has been associated with the poor prognosis of OSCC such as late diagnosis, enhanced risk of recurrence and metastasis in the locoregional lymph nodes, and ineffective response rate of currently used therapeutic strategies.[3,7] Oral cancer’s asymptomatic nature and lack of distinguishing symptoms in its early stages are also associated with its identification at advanced clinical stages. Another major reason of late diagnosis is the use of limited and conventional clinicopathological alterations (such as TNM staging). Therefore, finding new and alternative diagnostic methods are essential for raising the success rates of early detection and treatments.
One of the recent strategies of diagnosing and evaluating the probability of recurrence of oral cancer is through studying the expression of cancer stem cells (CSCs).[8-10] CSCs are a sub-population of tumor cells that can initiate tumorigenesis and underwrite the relapses.[9,11] Among the various CSC markers, the two most dependable and extensively used markers are CD44 and CD133.[12,13] Pentaspan transmembrane glycoproteins: CD133 family is mostly expressed in hematopoietic stem cells, endothelial progenitor cells, neuronal stem cells, and glial stem cells.[14] Another glycoprotein involved in cell–cell communication, cell adhesion, and cell migration is CD44.[9,11,12] In addition, it has been shown that CD44 has a role in the invasion and metastasis of a variety of tumor cells.[12]
Among the many proteinaceous biomarkers, several studies have revealed the molecular function of cytokines in the tumor microenvironment and suggested that inflammatory cytokines such as interleukin (IL)-6, IL-1, IL-8, IL-10, and TNFα are involved in the processes causing the onset, growth, invasion, and metastasis of oral cancer.[15-17] Inflammatory cytokines also studied as crucial biomarkers for early detection of oral cancer subjects in the blood as well as in the saliva.[15-17] The cytokine interleukin-1 beta (IL-1β) belongs to the IL-1 family. It is produced by the activated macrophages, monocytes, dendritic cells, and regulates the inflammatory responses. Some reports also linked IL-1β perturbations with oral lesion pathogenesis.[18] We were compelled by this to learn more about the relationship between IL-1β and the development of tumors as well as its diagnostic utility in OSMF and OSCC patients.
In our recent findings,[19] we have reported the presence of CSC markers in OSCC and OSMF patients, and we have seen a relationship between this presence and clinicopathological alterations such tumor size, tumor stage, node involvement, metastasis, and pathological grade.[19] However, the possible association or parallel alterations of the level of IL-1β in these CSC-positive and CSC-negative individuals of the OSMF and OSCC groups is still unexplored. We additionally intended to explore the association of extent of CSC marker (CD133 and CD44) expression in terms of IHC scoring (0–4) with simultaneous alteration of IL-1β. Our working hypothesis was based on this unique approach in establishing the heterogeneity effect of CSC markers in terms of their differential expression with plausible parallel changes in the levels of IL-1β. Surprisingly, in both the OSMF and OSCC groups, no prior investigations simultaneously connected CSC expression with IL-1β changes. Hence, in the current study, our strategy is novel in a way that we intended to simultaneously examine the IL-1β changes with CSC marker (CD44 and CD133) expression both in the OSMF and OSCC conditions. In addition, we sought to determine if the OSMF and OSCC groups’ expression of CSC markers and/or tobacco use behaviors were influencing changes in blood IL-1β levels.
Materials and Methods
The Era Lucknow Medical College and Hospital, Era University, India, and the Amity Institute of Biotechnology, AUUP, Lucknow, U.P., India, conducted the current study. A total of 135 people were included in the study. There were sixty each in the oral cancer (OSCC) and pre-cancer (OSMF) groups, as well as 15 healthy controls. These groupings were made according to established classifications.[20,21] Participants in the OSMF groups were classified based on symptoms such as ulceration, a burning feeling in the mouth, dry mouth, blanching oral mucosa, and increased submucosal tissue fibrosis.[15,21] OSMF begins with fibrotic bands in the retromolar area and advances to the buccal mucosa, eventually encompassing the soft palate, uvula, faucial pillars, and possibly the throat.
People with OSCC were chosen based on their medical histories, and then, a physical examination is done to check for deep tumor invasion into the tissues around the tongue and other areas of the oral cavity. Microscopically variable degree of keratinisation, cellular and nuclear pleomorphism and mitotic activity was also examined. The classification of tumors was also based on factors including tumor size, location, histologic malignant grade, lymphovascular invasion, and tumor thickness. All of the participants in the OSCC and OSMF groups had a history of chewing tobacco (including gutkha, khaini, and other varieties), smoking, and using pan masala (including non-tobacco plain masala, betel quid, and other varieties).
Inclusion criteria
-
Patients with OSMF symptoms were included in the research. This includes conditions such as diffuse submucous fibrosis, dry mouth, ulceration, blanching of the oral mucosa, and burning sensations.
-
The research included patients who displayed the characteristics of OSCC. This involves extensive tumor invasion into surrounding tongue and oral cavity tissues, variable degrees of mitotic activity, nuclear and cellular pleomorphism, and keratinization. Tumor characteristics such as tumor size, tumor location, histologic malignant grade, lymphovascular invasion, and tumor thickness were also taken into account. Subjects who have never before undergone any form of treatment (such pre-operative radiation or chemotherapy).
-
The study’s healthy control group consisted of age and sex-matched individuals without any indications of oral pathology, inflammation, pre-oral cancer or cancer-like alterations, or a history of any other disease.
Exclusion criteria
-
Any person who has had oral cancer and another form of cancer in the past or present, as well as anyone with an immune deficiency syndrome, TB, or another chronic illness.
-
Hypersalivate drugs such as antihistamines, anticholinergics, beta-adrenergic blockers, and antihypertensives are not permissible.
-
3.Those who have any type of oral pathology, inflammation, or other persistent comorbidity for healthy controls.
Collection of samples
All subjects gave their written informed consent before the collection of the tissue and blood samples in compliance with ethical standards. The Human Ethics Commission authorized the study and ELMC/R cell/2018/EC/2034 was used as institutional ethics protocol and ethical approval number. All cases were categorized using the WHO guidelines. The International Union Against Cancer[22] established staging and grading.
Sample of tissue
From enrolled patients who underwent surgery at over a 3-year period, formalin-fixed, paraffin-embedded tissue specimens were obtained. The subjects were examined by two qualified pathologists, who also confirmed the histological diagnosis of each lesion.
Sample of blood
Serum samples were collected between 9:30 AM and 1:00 PM in non-stimulatory conditions for the determination of serum IL-1β levels. Blood samples were taken from participants with OSCC and OSMF classifications before surgical therapy. The serum was immediately taken for ELISA and the blood was centrifuged (Remi, C-24BL) at 1500 rpm at 2–8°C for 15 min. The samples were stored for use at −20°C (Euronova).
Histopathology
Histopathology was performed in accordance with a previously established method, with minor modifications.[19,23] Following fixation, specialist pathologists visually evaluated the tissue samples during the grossing process for questionable areas that required microscopic inspection, and these portions were removed as tissue blocks. Tissues that were embedded were thinly sectioned and placed on glass slides. To learn more about the staining method used for a particular area, the distinct barcode found on each slide.
Immunohistochemistry (IHC)
With a few minor adjustments, IHC was performed in accordance with previous methods.[19,23] Sections with a thickness of 4 μm were produced in the OSCC and OSMF groups and then submitted to standard hematoxylin and eosin inspection by our expert pathologists to confirm the diagnosis. These sections of all pathological stages of OSCC were then immunohistochemically analyzed. Anti-CD133 polyclonal antibody (1:50 dilution, Proteintech, USA) and rabbit anti-CD44 polyclonal antibody (1:100 dilution, Dako, Denmark) were the two antibodies we used. For IHC staining, sections were completely fixed on microslides covered with polylysine. Two 10-minute dips in brand-new xylene were used to deparaffinize the tissue. The tissue was rehydrated for five minutes each in 90, 80, and 70% alcohol. After soaking in a buffer solution, tissue sections were heated in the microwave at 850 W for 5 min, 600 W for ten, and 400 W for five. Before being placed in a wash buffer made up of 950 mL of distilled water and 50 mL of buffer, the slides were allowed to cool. Extra buffer was wiped from the slides with tissue paper. The tissue sample was then gently rinsed twice with PBS after being submerged in 50 μL of H2O2 for 5 min. The tissue sample was then gently washed twice with PBS after being incubated at room temperature (RT) for an additional hour. After adding the secondary antibody, the samples were incubated for 30 min at RT before being 3 times washed with PBS. A drop of diaminobenzidine and 1 mL of substrate buffer were combined to create the substrate chromogen solution, which was incubated for 5 min at RT before being gently rinsed with PBS. The slides were washed with tap water for 5 min after being counterstained with hematoxylin for 2–5 min.
Immunohistochemical scoring
The immunohistochemical scoring was carried out in accordance with the procedure, with minor changes.[19,20] By selecting five hot spots (the most reactive areas on each slide) at a 10-objective and counting at a 200-fold magnification using (Model number- U-LH100-3, Tokyo, Japan), the expression and density of CSC markers were assessed. CSC density was calculated as the number of tagged CSCs per optical field for each antibody. Each of the five locations was counted twice, and the total was averaged for each tumor portion. This method was performed for each tumor sample, both within and along the tumor’s invasive margins. Positive CD44 and CD133 expression were seen in the cell membrane as a light brown stain. The number of positively stained cells was counted on representative sections of the slice with a minimum of 100 cells per field at a magnification of 20×, allowing for the detection of all stained regions indicating positivity. The amount of positive tumor cells was visually evaluated under a microscope to assess CD133 and CD44 expression. The immunohistochemical scoring is a semi-quantitative method based on the percentage of membranous staining-positive cells and the degree of staining in a particular cell: Immunoreactivity score equals the product of the proportion positive and the intensity score. Scores 0 (<10% of epithelial cells stained positively), 1 (between 0 and 20%), 2 (between 20 and 50%), 3 (between 50 and 75%), and 4 (more than 75%) were assigned. The positivity for CD44 and CD133 was calculated using previously reported criteria.[19,20] Two authors independently scored and interpreted the data without knowledge of additional clinical-pathological characteristics. We divided CD44 and CD133-positive participants into two categories for clarity of analysis. The first group combined individuals with Scores of 1 and 2 (low scores), while the second group combined individuals with Scores of 3 and 4 (high scores). A low score indicates that CD44 and CD133 are expressed to a lesser amount, while a high score indicates that they are expressed to a greater extent.
Evaluation of circulatory IL-1β levels
The inflammatory cytokine IL-1β was measured using a previously published protocol with minor alterations.[24] A commercially available ELISA kit was used to assess the levels of the inflammatory cytokine IL-1β in the blood with Catalogue no. KB1063 procured from Krishgen Biosystems (Mumbai, India). The ELISA test was performed in accordance with the protocol provided by the Krishgen Biosystems based on sandwich ELISA. The absorbance was measured with an ELISA reader (Bio-Rad, China). The absorbance was taken at 470 nm within 25 min of the process being stopped. The serum IL-1β levels were represented as pg/mL.
Statistical analysis
One-way analysis of variance (ANOVA) with Tukey’s multiple comparison post hoc test was performed by GraphPad Prism (version 8.0). The multiple regression method was applied by multivariate analysis using the SPSS software (Version 23). When CD44 or CD133 were positive, CSC markers were coded as 1; when they were negative, they were coded as 0. The same 1 and 0 values were used to indicate the presence or absence of habits. For CSC markers (CD44 and CD133) and behaviors (tobacco chewing, smoking, and pan masala), separate regression models were created to examine IL-1β variations in the OSMF and OSCC groups. P < 0.05 was used as the significant level. The means standard error of the means is displayed for all data.
Results
Expression of CD44 and CD133 in the OSMF and OSCC groups
Figure 1 represents IHC staining for CD44 and CD133 in the OSMF and OSCC groups.
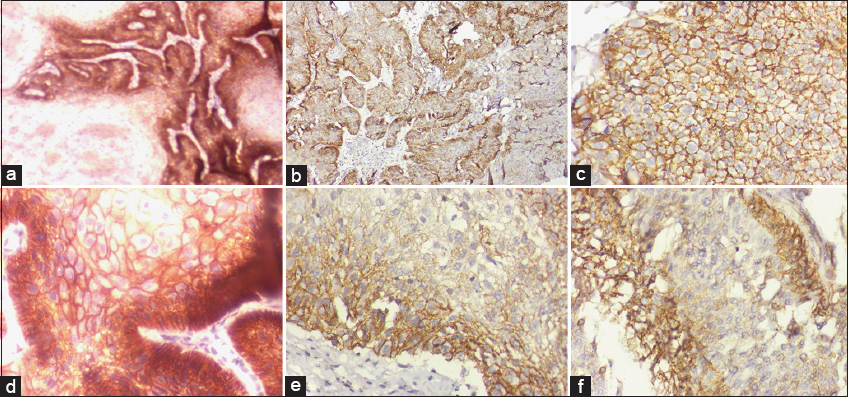
- Representative figures of IHC staining for CD133 and CD44 in the OSMF and OSCC groups. Microscopic illustration of CD133 expression in normal oral epithelial tissue after IHC staining; 200× magnification (a) OSCC tumor tissue stained for CD133 expression demonstrates cytoplasmic staining at a 200× magnification. (b) CD133 immunostaining confirms that OSMF-displaying inflammatory cells are dispersed among the oral epithelium’s layers, magnification 200× (c) Normal buccal mucosa showing CD44 expression in the majority of epithelial cells, including fibroblasts, magnification 200× (d) Membranous IHC sections from well-differentiated OSCC exhibit positive CD44 expression, magnification 200× (e) IHC labeling of CD44 reveals the OSMF stage and active cells in the oral submucosa’s juxtaepithelial connective tissue, magnification 200× (f)
The IHC results showed that in the OSMF group (n = 60), among the total CD44+ subjects, 26 participants presented IHC low score (Scores 1 and 2) while 19 displayed high score (Scores 3 and 4) and rest of the 15 participants are CD44- (Score 0). Whereas in case of CD133+ individuals, 34 displayed low score, 12 presented high score, while 14 belongs to CD133-.
The IHC results displayed that in the OSCC cases (n = 60), among the total CD44+ patients, 12 individuals presented low score (Scores 1 and 2) while 39 displayed high score (Scores 3 and 4) and rest of the 09 participants belong to CD44-. Whereas in case of CD133+ individuals, 11 displayed low score, 39 presented high score, while 10 belongs to CD133-.
IL-1β level in the OSMF and OSCC groups
As shown in Figure 2, we first compared the amount of IL-1β in blood samples from the OSMF and OSCC groups, which comprise all patients (without taking into account the expression of CSC markers), to healthy control subjects. We observed enhanced levels of IL-1β in the OSCC group (161.5 ± 5.267 pg/mL) with relatively lower levels in the OSMF individuals (110.0 ± 5.589 pg/mL). When we performed one-way ANOVA and analyzed Tukey’s multiple comparisons test, the results showed that IL-1β levels were significantly higher (P < 0.001) in the OSMF and OSCC persons compared to the control group. In addition, we found that the OSCC group had considerably (P < 0.001) higher levels of IL-1β than the OSMF group [Figure 2].
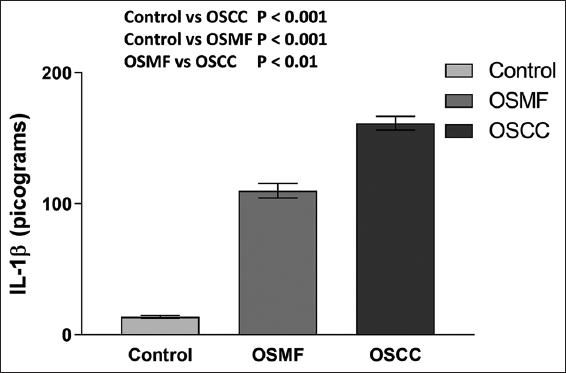
- Histogram showing the IL-1β levels in the OSMF, OSCC, and healthy control groups. The results are shown as mean S.E.M. Tukey’s multiple comparisons were performed in one-way ANOVA analysis.
IL-1β levels in participants with CD44 positivity versus negativity
Alterations in the OSMF group
As depicted in Figure 3, the levels of IL-1β in the CD44-positive and CD44-negative individuals in the OSMF group were found to be 131.0 ± 6.64 pg/mL and 59.37 ± 6.293 pg/mL respectively. One-way ANOVA and Tukey’s multiple comparisons test indicated a minor (P > 0.05) rise in IL-1β levels in the CD44-negative individuals compared to the control group but a significant (P < 0.001) increase in IL-1β levels in the CD44-positive individuals. In addition, in the OSMF group, CD44-positive individuals have considerably (P < 0.001) greater levels of IL-1β than CD44-negative persons [Figure 3].
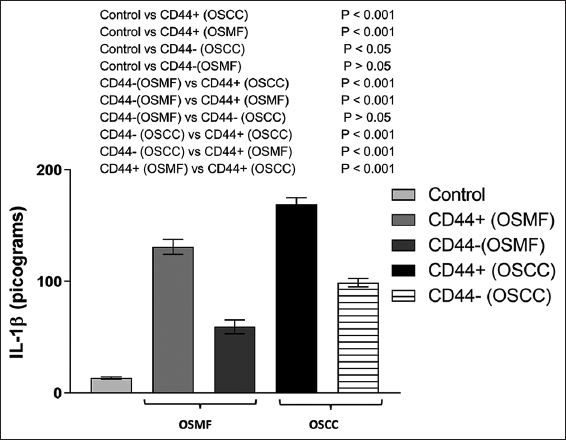
- IL-1β levels in the groups of healthy controls, OSMF (CD44+ and CD44), and OSCC (CD44+ and CD44-) are shown in a histogram. Tukey’s multiple comparisons were performed in one-way ANOVA analysis
Alterations in the OSCC group
As shown in Figure 3, when the level of IL-1β was assessed in the CD44-positive and CD44-negative persons in the OSCC group, we found that they had respective IL-1β levels of 169.30 ± 5.54 pg/mL and 98.99 ± 3.87 pg/mL. When comparing the OSCC group to the control group, one-way ANOVA revealed a significant rise in IL-1β levels in both CD44-positive (P < 0.001) and CD44-negative (P < 0.05) individuals. In the OSCC group, CD44-positive individuals had significantly (P < 0.001) higher levels of IL-1β than CD44-negative participants [Figure 3].
Another interesting finding was that people in the OSCC group who tested positive for CD44 had considerably (P < 0.001) higher levels of IL-1β than those in the OSMF group [Figure 3]. This definitely shows a more severe increase in IL-1β levels in the CD44-positive OSCC group members.
IL-1β levels in relation to CD44 differential expression in the OSMF and OSCC group
For assessing the variable extent of CD44 expression on IL-1β levels of these individuals in the OSMF and OSCC group, we analyzed the IL-1β levels in individuals with IHC scoring (Scores 0–4) representing differential CD44 expression. For the clarity of analysis, we classified CD44-positive individuals into two subgroups. The first group was made by including the individuals showing Scores 1 and 2 (low score) and the second group was created by including the individuals showing Scores 3 and 4 (high score). Low score denotes lower extent of CD44 expression while high score represents relatively higher CD44 expression.
As shown in Figure 4a, there is a significant enhancement of IL-1β levels in the low score (Scores 1 and 2) group (P < 0.004) as well as in the high score (Scores 3 and 4) group (P < 0.001) as compared with CD44-negative individuals (Score 0) with OSMF conditions.
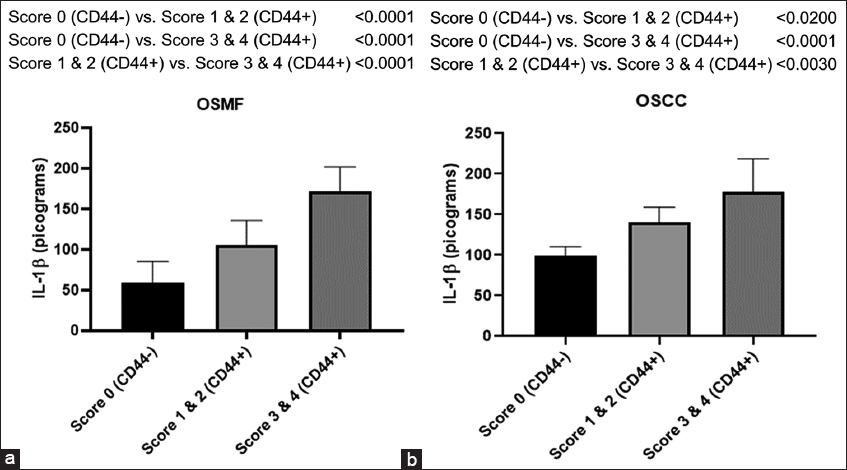
- Histogram showing IL-1β levels in CD44- and CD44+ subjects with groups belonging to differential expression of CD44 expressed in terms of scoring (0–4) in OSMF (a) and OSCC (b) participants. Tukey’s multiple comparisons were performed in one-way ANOVA analysis
Similarly, in the OSCC individuals, there is a significant enhancement of IL-1β levels in the low score (Scores 1 and 2) group (P < 0.003) as well as in the high score (Scores 3 and 4) group (P < 0.001) when compared with CD44-negative individuals (Score 0) as shown in Figure 4b.
It is interesting to note that persons with high scores (Scores 3 and 4) compared to low scores (Scores 1 and 2) of CD44-positive individuals belonging to both OSMF and OSCC individuals had significantly higher levels of IL-1β (P < 0.001). This clearly indicates that there is a parallel enhancement of IL-1β levels with an increase in the extent of CD44 expression in terms of IHC scoring during OSMF and OSCC conditions.
Effect of CD44 expression and habits on IL-1β changes during OSMF and OSCC conditions
Multiple regression analysis was used in a multivariate analysis to determine the effects of CSC marker (CD44) expression and habits (smoking, chewing tobacco, and pan masala) on IL-1β levels in the OSMF and OSCC groups.
Multiple regression analysis in the OSMF group
As seen in Table 1, the increment in the IL-1β score is 64.95 when people cross the threshold of being CD44 positive. This increase makes a major contribution to the enhancement of IL-1β. However, the impact of behaviors (such as smoking, chewing tobacco, and pan masala) is not significantly influencing the IL-1β value. When it comes to prediction the changes in IL-1β in the OSMF group, the regression model is significant (P < 0.0002).
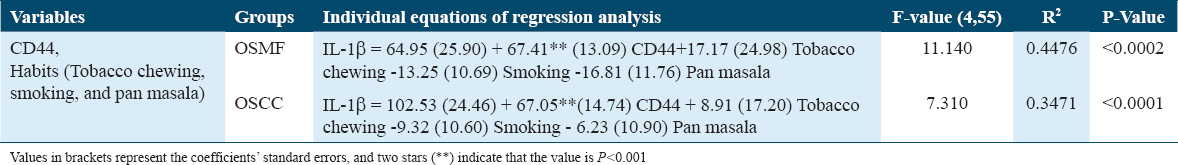
Multiple regression analysis in the OSCC group
The increase in IL-1β value is 102.53 for those persons who cross the CD44 barrier, demonstrating that this increase considerably contributes to the enhancement of IL-1β as shown in Table 1. However, the impact of behaviors (such as smoking, chewing tobacco, and pan masala) is not significantly influencing the IL-1β value. When it comes to anticipating the changes in IL-1β in the OSCC group, the regression model is significant (P < 0.001). In addition, it can be seen from comparing regression equations of the OSMF and OSCC data [Table 1] that the OSCCs increase in IL-1β as a result of CD44 positive is 63% higher than the OSMF’s.
IL-1β levels in CD133 positive versus negative participants
Alterations in the OSMF group
Figure 5 illustrates the IL-1β levels in the CD133-positive and CD133-negative individuals in the OSMF group. These values were determined to be 120.8 ± 6.80 pg/mL and 60.31 ± 6.52 pg/mL, respectively. One-way ANOVA and Tukey’s multiple comparisons test revealed that the levels of IL-1β in CD133-positive (P < 0.001) and CD133-negative (P < 0.05) people were significantly higher than those in the control group. In addition, in the OSMF group, CD133-positive individuals have considerably (P < 0.001) greater levels of IL-1β than CD133-negative persons [Figure 5].
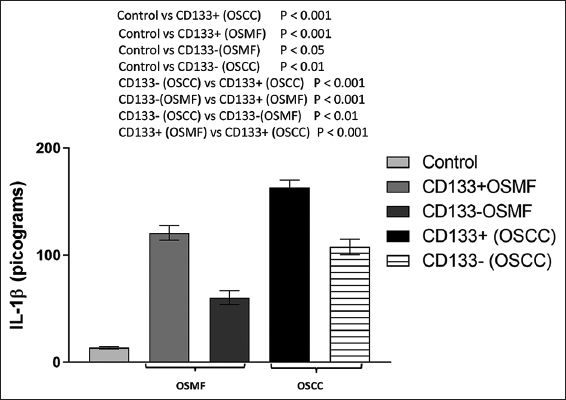
- Histogram showing the amounts of IL-1β in the OSMF (CD133+ and CD133-), OSCC (CD133+ and CD133-), and control groups. Tukey’s multiple comparisons were performed in one-way ANOVA analysis
Alterations in the OSCC group
As illustrated in Figure 5, when the level of IL-1β was assessed in the CD133-positive and CD133-negative persons in the OSCC group, we observed that the IL-1β levels were 163.2 ± 6.74 pg/mL and 107.7 ± 7.29 pg/mL, respectively. When comparing the OSCC group to the control group, a one-way ANOVA revealed a significant rise in IL-1β levels in both CD133-positive (P < 0.001) and CD133-negative (P < 0.01) people. In the OSCC group, CD133-positive individuals have substantially (P < 0.001) greater levels of IL-1β than CD133-negative individuals. Another interesting finding was that people in the OSCC group who tested positive for CD133 had substantially (P < 0.001) higher levels of IL-1β than those in the OSMF group [Figure 5].
IL-1β levels in relation to CD133 differential expression in the OSMF and OSCC group
As shown in Figure 6a, there is a significant enhancement of IL-1β levels in the low score (Scores 1 and 2) group (P < 0.003) as well as in the high score (Scores 3 and 4) group (P < 0.001) when compared with CD133-negative individuals (Score 0) during OSMF condition.
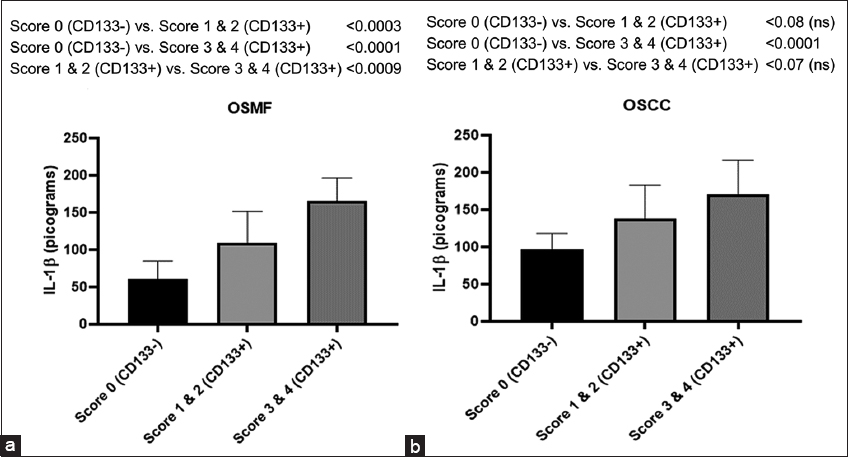
- Histogram showing IL-1β levels in CD133- and CD133+ subjects with groups belonging to differential expression of CD133 represented in terms of Scoring (0–4) in OSMF (a) and OSCC (b) people. Tukey’s multiple comparisons were performed in one-way ANOVA analysis
Similarly, in the OSCC group, we observed an increase trend of IL-1β levels in the low score (Scores 1 and 2) group though insignificant (P < 0.08), whereas in the high score (Scores 3 and 4) group, the enhancement is significant (P < 0.001) as compared to CD133-negative individuals (Score 0) as shown in Figure 6b.
It is interesting to note that there is a substantial (P < 0.009) rise in IL-1β levels in participants when a comparison between high- and low-score groups is made of CD133-positive individuals in the OSMF participants [Figure 5a], while no significant increase (P < 0.07) observed between high score and low score groups of CD133-positive individuals in the OSCC participants [Figure 6b].
IL-1β levels in CD44 positive versus CD133 positive during OSMF and OSCC conditions
We further compared the IL-1β levels of CD44 and CD133-positive individuals in the OSMF group and interestingly found no significant difference between the groups [Figure 7]. When the IL-1β levels of CD44 and CD133-positive patients were evaluated in the OSCC group, similar findings were seen [Figure 7]. These findings showed unequivocally that levels of IL-1β are elevated in both cases, regardless of whether the CSC marker CD44 or CD133 is expressed.
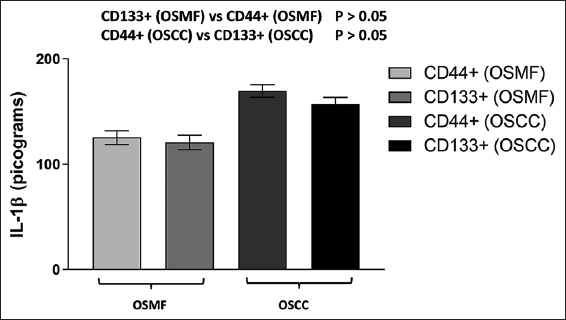
- IL- levels in the OSMF (CD44+ and CD133+) and OSCC (CD44+ and CD133+) groups are represented by the histogram. Tukey’s multiple comparisons were performed in one-way ANOVA analysis
Effect of CD133 expression and habits on IL-1β changes during OSMF and OSCC conditions
Multiple regression analysis in the OSMF group
According to Table 2, when a person crosses the line into CD133 positivity, their IL-1β score increases by 31.31. This increase makes a major contribution to the enhancement of IL-1β. However, the impact of behaviors (such as smoking, chewing tobacco, and pan masala) is not significantly influencing the IL-1β value. When it comes to predicting the changes in IL-1β in the OSMF group, the regression model is significant (P < 0.0006).
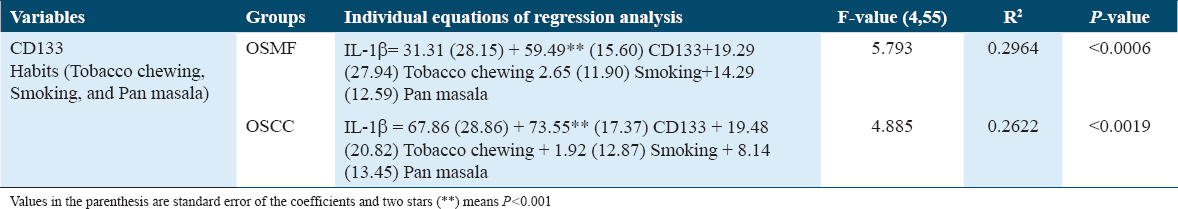
Multiple regression analysis in the OSCC group
The increase in IL-1β value is 67.86 for people who cross the CD133 threshold, showing that this increase considerably contributes to the enhancement of IL-1β, as shown in Table 2. On the other hand, the value of IL-1β is not considerably influenced by behaviors. In terms of foretelling the IL-1β changes in the OSCC group, the regression model is significant (P < 0.0019). In addition, it can be seen from the corresponding regression equations of the OSMF and OSCC data [Table 2] that the OSCC’s increase in IL-1β as a result of CD44 positive is 46 percent higher than OSMF’s.
Discussion
Finding biomarkers that could predict or identify cancer at an early stage is one of the decisive factors in improving the prognosis for oral cancer. We deliberately included biomarkers of different origins such as inflammatory molecule-IL-1β and cancer relapse factor-CSCs, with the notion that studying concurrent alterations offered us more detailed diagnostic inputs. In this study, we described changes in IL-1β in oral pre-cancerous and cancerous conditions, as well as its connection to the expression of CSC markers in these individuals. This work is distinctive and original in that we analyzed the biomarker ability of IL-1β in oral pre-cancerous and cancerous persons and simultaneously investigated the connection with the extent of CSC expression in terms of differential expression of CD44 and CD133.
The current work clearly displayed an increased serum level of IL-1β during OSMF and OSCC conditions. However, the enhancement of IL-1β levels was more prominent in OSCC condition. Interleukins have been investigated for use as serum biomarkers for a variety of malignancies, including oral cancer.[25] IL-1β is a key player in chronic inflammation and has been investigated as a potential early indicator for oral lesions.[18,26] Few studies reported that the oral malignant transformation is linked with an enhancement of IL-1β level and demonstrated that OSCC cell lines release large amounts of IL-1β, which promotes tumor growth through the autocrine system.[18,26] In addition, IL-1β is investigated as one of the critical nodal genes in the tumor microenvironment in the development of oral cancer.[18] The IL-1β produced by the tumor modifies a chain of events that, sooner or later, contribute to the progression of carcinogenesis.[18] The hyperactivation of the epidermal growth factor receptor (EGFR) pathways is a shared feature of oral cancer and chronic inflammation. Recent research has shown that tumor-derived IL-1β stimulates the production of the chemokine CXCL1, activating EGFR through CXCR2, and causing oral lesions to proliferate.[27]
In OSMF (pre-cancerous) and OSCC (cancerous) groups, we observed elevated expression of the CSC markers: CD133 and CD44. These results are in line with a few other investigations in which different oral cancer cases varied in the expression profile of CSC markers.[8,12,13] CD44 and CD133 are investigated as surface bio-markers of CSCs.[12] CD44 is known to influence cell migration and adhesion, tumor invasion, and metastasis of cancers.[12] The molecular explanation is provided by CD44’s capacity to activate a number of receptor tyrosine kinases, which increases tumor cell proliferation and survival rates by activating the MAPK and PI3K/AKT pathways.[13,28] CD133 is also used as biomarker in various malignancies; however, its role is still not conclusive.[14] Few studies are shown CD133 in both normal and malignant stem cells in oral lesions and related animal models.[14,22] CD133 is involved in cell differentiation and signal transduction and acts as a vital propagator of tumorigenesis.[29]
Researchers are addressing the problem of late diagnosis of oral cancer by various new approaches such as the quantitative metric alterations, specifically the increase nuclear dimension while reduction in cellular dimension has been suggested as early morphometric alteration in OSCC patients.[30] Another study suggested that examining the mast cell density can indicate the initiation and progression of OSMF.[31] In addition, a study correlated the role of matrix metalloproteinase-9 expression in the perturbations of mucosal vasculature of the OSCC and pre-oral cancer patients linking the basis of enhanced metastasis through angiogenesis.[32] Recently, TWIST oncogene which is a transcription factor in modulating epithelial-mesenchymal transition has been reported as an important biomarker of early diagnosis of various types of oral lesions.[33] In spite of these diverse strategies, the situation has not improved much, probably due to the involvement of multiple hallmarks and pathophysiological origin of oral cancer. This indicates the need to improve the diagnostic possibilities related to oral cancer. Another important point to be considered that in most pre-cancer conditions such as OSMF, the conventional clinicopathological changes may not be detected or identified. Therefore, it is important to research additional molecular tumorigenic factors and diagnostic biomarkers for both oral pre-cancer and cancer cases. Hence, in the current investigation, we purposefully looked at biomarkers from two distinct sources (cytokines and CSCs) in both OSCC and OSMF subjects. This allows us to provide more precise diagnostic inputs than if we had only looked at one biomarker at a time. The most exciting and novel data we found in this regard are simultaneous changes in IL-1β levels in CD133 and CD44-positive and CD44-negative persons in pre-cancer (OSMF) and malignant (OSCC) groups. Our study found that CD133 and CD44-positive persons in both OSMF and OSCC conditions had higher levels of IL-1β than CD133 and CD44-negative individuals. Although the levels of IL-1β improved in these people, it was definitely to a lesser extent. Furthermore, the levels of IL-1β increased in both OSMF and OSCC participants, regardless of the type of CSC markers (CD44 or CD133). However, we clearly observed that the enhancement of IL-1β levels was more prominent in OSCC individuals as compared to OSMF people. Regression analysis revealed no combined effect in raising IL-1β levels when CD44+ and CD133+ were both expressed.
The purpose of the multiple regression analysis was to evaluate the changes in IL-1β and the potential impact of CSC expression and behavioral patterns (tobacco chewing, smoking, and pan masala). When participants in the OSMF and OSCC groups crossed the CD44/CD133-positive threshold, the increase in IL-1β levels was dramatically increased. However, the influence of habits did not contribute significantly to the IL-1β value. Smaller data sets or habit overlap among group members may be the reason for these differing effects of habits. To fully comprehend the impact of each habit on IL-1β alterations, a bigger data collection of each habit may be necessary, which may be explored in the future. As revealed by numerous reports,[2,5] habits such as tobacco chewing, smoking, and pan masala may have a role in the development of oral lesions, but their direct relationship with IL-1β was not proven in the current investigation. However, we do not completely rule out the idea that these habits do not impact cytokine levels; rather, we just point out that, in the current data set, the impact of habits seems to be less significant than that of CSCs expression. Separate regression models show that the increase in IL-1β caused by CD44 and CD133 is 63 and 46 percent higher in OSCC than in OSMF, respectively. This shows that the OSCC group has a greater influence on IL-1β rise than the OSMF group due to CSC expression.
Uncertainty exists regarding the molecular underpinnings of the concurrent increase in the expression of CSC markers (CD44 and CD133) and IL1β and its potential relationship to the OSMF and OSCC. However, few recent reports indicated a possible association between the two alterations.[34,35] According to a report, IL1β from bone marrow promotes the colonization of breast cancer cells by upregulating intracellular NFkB and CREB signaling, modifying autocrine Wnt signaling, and promoting the development of CSC colonies.[34] Another major contributor of tumor growth in oral cancer is fibroblast activation.[36] Various proinflammatory cytokines, such as IL-1β, increase ECM remodeling and enable cancer-associated fibroblasts conceivably through NF-κB and JAK-ROCK-STAT3 signaling pathways.[35,37] Oral cancer cells express CCL22 mRNA when IL-1β from cancer-associated fibroblasts activates the transcription factor NF-κB.[35] Thus, the link of IL-1β increase in CSC-positive persons with OSMF and OSCC conditions can be related to CSCs ability to promote carcinogenesis by communicating with stromal fibroblasts through IL-1β disruptions.[35] Thus, the heterogeneity effect of CSC marker in terms of CD44 and CD133 differential expression with parallel changes in the levels of IL-1β can be reasoned. In light of this, the current study underlined the significance of investigating inflammatory cytokine perturbations in relation to the perturbations of CSCs in oral lesions.
Conclusion
The data revealed in the present study highlighted several important facts. First, we have clearly demonstrated that there is a parallel enhancement of pro-inflammatory cytokine IL-1β in the CD44 and CD133-positive individuals both at the pre-cancerous and cancerous stage. Therefore, an effective approach for the early diagnosis of OSMF and OSCC diseases involves simultaneously examining pro-inflammatory cytokine changes and CSC alterations. Second, grouping of such molecular biomarkers (cytokine and CSCs), especially in pre-cancer stage where the conventional clinicopathological changes may not be identified, can be a vital strategy for assessing the risk of cancer. Third, the multivariate analysis indicated that among the factors which contribute inflammation-related changes in cancer, CSCs expression seems to be associated predominantly as compared to studying only the habit pattern and/or history of patients. Creating similar approaches could assist us in gaining new knowledge about how cancer progresses in connection to the expression of different CSC markers and the implications for cytokine alterations. This will significantly affect how carcinogenesis is understood and how its risk is assessed, perhaps leading to early detection, treatment, and management of the high rates of morbidity and mortality associated with various types of oral malignancies.
Ethics approval and consent to participate
The 1964 Helsinki Declaration and its following modifications, or equivalent ethical norms, were followed in all procedures carried out in studies involving human volunteers. The study received approval from the Eras Lucknow Medical University Research Ethics Committee with reference number ELMC/R Cell/2018/EC/2034. As per ethical requirements, suitable written informed consent was obtained from all relevant individuals.
Consent for Publication
Not applicable.
Availability of Data and Material
All relevant data are within the paper.
Competing Interests
All authors of this work have declared that there is no conflict of interest.
Funding Statement
This work does not receive any funding.
Authors’ Contributions
All authors contributed to the study origin and planning. Material preparation, data collection, and analysis were performed by Shriddha Awasthi and Sharique Ahmad. The manuscript was written by Ausaf Ahmad. Mohammed Shariq Iqbal and Rahul Gupta reviewed and validated the analysis, statistics, and grammar checking at the final stage. All authors examined and permitted the final manuscript.
Acknowledgments
The necessary laboratory facilities for conducting this research were provided by Amity Institute of Biotechnology, AUUP, Lucknow Campus, and Eras Lucknow Medical College. In addition, we would like to express our gratitude and respect to the late Prof. A. N. Srivastava for his guidance and assistance.
References
- Oral fibrosis and oral cancer:From molecular targets to therapeutics. Int J Mol Sci. 2022;23:6110.
- [Google Scholar]
- Oral squamous cell carcinoma associated with oral submucous fibrosis have better oncologic outcome than those without. Oral Surg Oral Med Oral Pathol Oral Radiol. 2017;124:225-30.
- [Google Scholar]
- Associations of oral and intestinal florae and serum inflammatory factors with pathogenesis of oral cancer. Eur Rev Med Pharmacol Sci. 2020;24:11090-5.
- [Google Scholar]
- Turmeric in the management of oral submucous fibrosis-a systematic review and meta-analysis. Int J Health Sci (Qassim). 2020;14:41-6.
- [Google Scholar]
- Significance of CD44 expression in head and neck cancer:A systemic review and meta-analysis. BMC Cancer. 2014;14:15.
- [Google Scholar]
- Clinicopathological correlation of stem cell markers expression in oral squamous cell carcinoma;Relation to patients`outcome. J Immunoassay Immunochem. 2021;42:571-95.
- [Google Scholar]
- Clinicopathological significance of cancer stem cell markers (OCT-3/4 and SOX-2) in oral submucous fibrosis and oral squamous cell carcinoma. Biomedicines. 2023;11:1040.
- [Google Scholar]
- Cancer stem cells-origins and biomarkers:Perspectives for targeted personalized therapies. Front Immunol. 2020;11:1280.
- [Google Scholar]
- Cancer cell CD44 mediates macrophage/monocyte-driven regulation of head and neck cancer stem cells. Cancer Res. 2020;80:4185-98.
- [Google Scholar]
- Clinical significance of CD44 and CD133 expression in oral potentially malignant disorder and oral squamous cell carcinoma. Hua Xi Kou Qiang Yi Xue Za Zhi. 2017;35:311-6.
- [Google Scholar]
- Suitability of CD133 as a marker for cancer stem cells in melanoma. Asian Pac J Cancer Prev. 2021;22:1591-7.
- [Google Scholar]
- Salivary and serum interleukin-6 levels in oral premalignant disorders and squamous cell carcinoma:Diagnostic value and clinicopathologic correlations. Asian Pac J Cancer Prev. 2016;17:4899-906.
- [Google Scholar]
- Serum levels of interleukins 6, 10, and 13 before and after treatment of classic hodgkin lymphoma. Arch Pathol Lab Med. 2011;135:483-9.
- [Google Scholar]
- The use of salivary cytokines as a screening tool for oral squamous cell carcinoma:A review of the literature. J Oral Maxillofac Pathol. 2012;16:256-61.
- [Google Scholar]
- Expression of interleukin-1ßand interleukin-8 in oral potentially malignant disorders and carcinomas. Front Oral Health. 2021;2:649406.
- [Google Scholar]
- Association of cancer stem cell markers CD44 and CD133 expression with clinicopathological changes in oral squamous cell carcinoma (OSCC) and oral submucosal fibrosis (OSMF) Res J Biotechnol. 2023;18:84-93.
- [Google Scholar]
- Staging and grading of oral squamous cell carcinoma:An update. Oral Oncol. 2020;107:104799.
- [Google Scholar]
- Malignant transformation of oral submucous fibrosis:Overview of histopathological aspects. Oral Surg Oral Med Oral Pathol Oral Radiol. 2016;122:200-9.
- [Google Scholar]
- The utility of CD44, CD117 and CD133 in identification of cancer stem cells (CSC) in oral squamous cell carcinomas (OSCC) Rom J Morphol Embryol. 2011;52:985-93.
- [Google Scholar]
- Immunohistochemistry analysis of CD44, EGFR, and p16 in oral cavity and oropharyngeal squamous cell carcinoma. Otolaryngol Head Neck Surg. 2017;157:239-51.
- [Google Scholar]
- Validation of salivary markers, IL-1b, IL-8 and Lgals3bp for detection of oral squamous cell carcinoma in an Indian population. Sci Rep. 2020;10:7365.
- [Google Scholar]
- Salivary and serum interleukin 1 beta, interleukin 6 and tumor necrosis factor alpha in patients with leukoplakia and oral cancer. Med Oral Patol Oral Cir Bucal. 2012;17:e10-5.
- [Google Scholar]
- IL-1b promotes malignant transformation and tumor aggressiveness in oral cancer. J Cell Physiol. 2015;230:875-84.
- [Google Scholar]
- Interleukin-1 beta transactivates epidermal growth factor receptor via the CXCL1-CXCR2 axis in oral cancer. Oncotarget. 2015;6:38866-80.
- [Google Scholar]
- High CD44 immunoexpression correlates with poor overall survival:Assessing the role of cancer stem cell markers in oral squamous cell carcinoma patients from the high-risk population of Pakistan. Int J Surg Oncol. 2022;2022:9990489.
- [Google Scholar]
- Distinct perturbations of oral squamous cell carcinoma patients:A quantitative cytomorphometric analysis. Int J Health Sci (Qassim). 2015;9:283-91.
- [Google Scholar]
- Mast cell density in oral submucous fibrosis:A possible role in pathogenesis. Int J Health Sci (Qassim). 2013;7:23-9.
- [Google Scholar]
- Correlation of matrix metalloproteinase-9 expression with morphometric analysis of mucosal vasculature in oral squamous cell carcinoma, oral epithelial dysplasia, and normal oral mucosa. Int J Health Sci (Qassim). 2018;12:36-43.
- [Google Scholar]
- Evaluation of immunohistochemical expression of TWIST in oral epithelial dysplasia and squamous cell carcinoma. Int J Health Sci (Qassim). 2020;14:33-9.
- [Google Scholar]
- Microenvironmental IL1b promotes breast cancer metastatic colonisation in the bone via activation of Wnt signalling. Nat Commun. 2019;10:5016.
- [Google Scholar]
- Cancer-associated fibroblast-derived interleukin-1b activates protumor C-C motif chemokine ligand 22 signaling in head and neck cancer. Cancer Sci. 2019;110:2783-93.
- [Google Scholar]
- Oral cancer stem cells drive tumourigenesis through activation of stromal fibroblasts. Oral Dis. 2021;27:1383-93.
- [Google Scholar]
- Crosstalk between cancer-associated fibroblasts and immune cells in the tumor microenvironment:New findings and future perspectives. Mol Cancer. 2021;20:131.
- [Google Scholar]