
Translate this page into:
Identification of potential biomarkers for bone metastasis using human cancer metastasis database
Address for correspondence: Mahima Bhardwaj, Department of Biotechnology, Vignan’s Foundation for Science, Technology and Research (Deemed to be University), Guntur, Andhra Pradesh, India. E-mail: drsachinbioinfo@gmail.com
This is an open-access article distributed under the terms of the Creative Commons Attribution-Noncommercial-Share Alike 3.0 Unported, which permits unrestricted use, distribution, and reproduction in any medium, provided the original work is properly cited.
This article was originally published by Qassim Uninversity and was migrated to Scientific Scholar after the change of Publisher.
Abstract
ABSTRACT
Objective:
Information theory has been successfully employed to identify optimal pathway networks, mutual information (MI), and entropy as a dynamic response in statistical methods and estimate input and output information in systems biology. This research aims to investigate potentially integrated gene signatures for bone metastasis using graph-based information theory from the dynamic interaction interphase.
Methods:
The expression dataset with the series ID GSE26964 for bone metastasis from prostate cancer was retrieved. The dataset was segregated for differentially expressed genes (DEGs) using the Human Cancer Metastasis Database. MI was considered to capture non-linear connections to classify the key DEGs from the collected dataset using gene-gene statistical analysis and then a protein-protein interaction network (PPIN). The PPIN was used to calculate centrality metrics, bottlenecks, and functional annotations.
Results:
A total of 531 DEGs were identified. Thirteen genes were classified as highly correlated based on their gene expression data matrix. The extended PPIN of the 13 genes comprised 53 nodes and 372 edges. A total of four DEGs were identified as hubs. One novel gene was identified with strong network connectivity.
Conclusion:
The novel biomarkers for metastasis may provide information on cancer metastasis to the bone by implying MI and information theory.
Keywords
Bone metastasis
information theory
mutual information
systems biology

Introduction
Prostate cancer (PCa) in males is the second most common type of cancer; one in 25 individuals worldwide may be diagnosed with it at some point in their lives, making it one of the leading causes of cancer-related deaths globally.[1,2] Since 2020, there have been an increased number of occurrences of PCa, one of the most common malignant tumors in men, with 248,530 cases reported and 34,130 fatalities.[3] Approximately 350,000 patients lose their lives to PCa each year, according to documentation. Due to the absence of early-stage clinical signs in PCa, the number of mortalities is extremely high.[4] Age, race, genetics, family history, obesity, and smoking are some of the most common risk factors for prostate tumor development.[5,6] Castration-resistant PCa, a problem in the clinical course, develops if the therapy for PCa is found unsuccessful. The disease thus puts a heavy economic burden on society and healthcare organizations.[7,8] The majority of patients with advanced PCa are also reported to have multiple metastases, which typically adversely affect the lymph nodes adjacent to the prostate but can also actually affect multiple organs and organ systems like the axial bones (84% of malignancies had these), distant lymph nodes (11%), liver (10%), respiratory system (7%), and brain (3%).[9] Once bone metastasis develops, it is reported that the patient’s chances of recovering are depleted. Pain, pathological fractures, and paraplegia are just a few of the complications that can result from PCa, which results in bone metastases, all of which significantly lower the patient’s quality of life. The prognosis seems to be a typical problem if bone metastasis occurs, and the survival rate is also dramatically reduced.[10,11] According to Paget’s “seed and soil” hypothesis, which was first put forth in 1889, the bone microenvironment offers a particularly favorable environment for the growth and intense development of tumor cells, which may contribute, at least in part, to PCa’s propensity to metastasize primarily to the bone.[12] Even with improvements in pharmacotherapeutic methods, bone metastases still have a negative impact on patient survival, necessitating earlier identification of “high-risk” individuals (PSA > 20). Because bone metastases have an impact on physiological bone turnover, the assessment of bone turnover markers has therefore been intensively studied for diagnostic and predictive purposes, as well as to support the development of anti-cancer medications. In addition, a thorough investigation of the potential predictive importance of bone metastasis biomarkers is presently underway.[13]
To investigate the role of different genes for bone metastases from PCa and to discover new biomarkers of bone metastases, analysis of the microarray data series GSE26964,[14] which was retrieved from the NCBI Gene Expression Omnibus (GEO),[15] was carried out. The information for this study was gathered from samples of PCa that had spread to the bones. The process started with identifying the differentially expressed genes (DEGs) between primary tumors, that is, PCa and metastasized tumors, that is, metastasized to bone. Then, these genes were used to construct a protein-protein interaction (PPI) network after the identification of target genes. Various centrality parameters were calculated, betweenness centrality being the major parameter for this study, which was further used to identify hub genes. These hub genes were used as input for the characterization of function and analysis of pathways. Furthermore, the reported genes’ functionality was validated by experimental evidence in the existing literature.
Methods
Various steps used for the pathway analysis and identification of key targets using information theory, mutual information (MI), and graph theory in conjunction with miRNA data are represented in Figure 1.
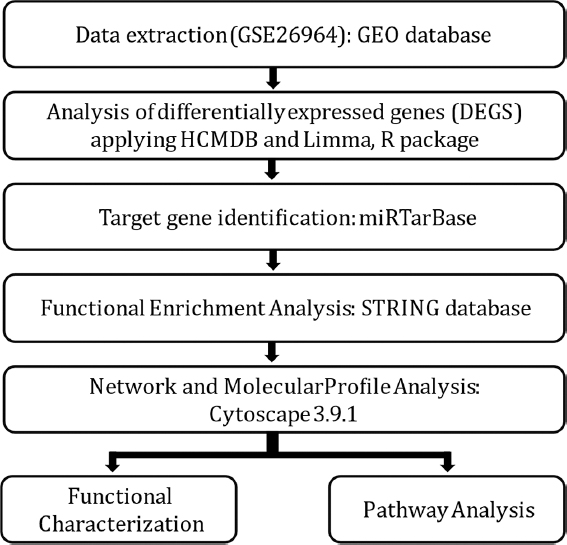
- Flowchart depicting the various steps included in methodology
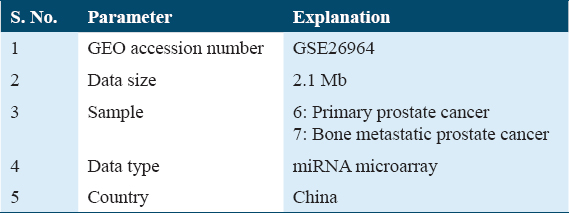
Data retrieval
Using the search term “Bone metastasis from PCa” and filters unique to an organism, that is, Homo sapiens, the GEO database (https://www.ncbi.nlm.nih.gov/geo/)[16] was searched to discover the gene expression profiles. The dataset GSE26964 was acquired using the Capitalbio mammal microRNA V3.0 platform.[17] Six primary and seven bone metastatic PCa samples from the collection were examined for their miRNA expression profiles using miRNA microarray analysis. In the retrieved dataset, total RNA was isolated from the tissues, followed by the isolation and labeling of low-molecular-weight RNA and the hybridization of 924 microRNAs with the Capitalbio V3.0 biochip. Dataset GSE26964 was retrieved from GEO, and Table 1 lists the parameters.
Differential expression analysis
The Human Cancer Metastasis Database (HCMDB)[18] and the limma package of R[19] were employed to analyze the DEGs, and numerous plots, including the volcano plot, box plot, density plot, and MD plot, were constructed to visualize DEGS and view distribution values. Five hundred and thirty-one genes that were up- and down-regulated by miRNAs have been discovered. The top-down- and up-regulated genes were selected from a total of genes. All the data about cancer and metastasis are kept in a database called HCMDB. The top-regulated and down-regulated genes were explicitly chosen and used for additional analysis in the study.
Target gene identification
The miRTarBase[20] technique was employed to identify the target genes. It is a free tool that uses miRNA to identify target genes. Further selections included the best validation technique for gene display. A few of the methods used for the validation procedure included the reporter assay,[21] western blot,[22] and qPCR.[23] The genes were also validated for the number and quality of citations. It was proposed to select the genes with the most string validations and the best citations.
Functional enrichment analysis
The Search Tool for the Retrieval of Interacting Genes and Proteins (STRING)[24] database was utilized to carry out the functional enrichment analysis. STRING is the name of the database used to study protein-protein interaction networks (PPIN). It is an online resource and scientific database of predicted and known PPIs. Information obtained from many sources, such as experimental data, computer prediction techniques, and free text collections, is included in the STRING database. It is openly available and constantly updated. Using a number of functional classification methods, such as GO,[25] Pfam,[26] and KEGG,[27] the database also serves to highlight functional enrichments in user-provided lists of proteins. More than 24.5 million proteins from more than 5000 different organisms are represented in the most recent version 11b. A group of academic institutions, including CPR, EMBL, KU, SIB, TUD, and UZH, collaborated to construct STRING.
A maximum of 76.92% of the 13 seed genes that displayed interaction did so over the course of the network’s sixth growth stage, indicating network expansion.
Network and molecular profile analysis
The network and molecular profile analyses were carried out using Cytoscape 3.9.1.[28] Open-source software called Cytoscape was used to combine, visualize, and explore biological networks. Ten of the 13 genes in the network showed associations. Three of the four clusters created by Clusterviz, which was utilized to create clusters from the network that was created, contained seed genes. The cluster analysis and visualization were carried out using the k-means clustering algorithm, which was used by ClusterViz.[29] Three widely used clustering algorithms-FAG-EC, EAGLE, and MCODE were included in the most recent version of ClusterViz, which compared the outcomes of several methods to perform additional analysis.
Functional characterization and pathway analysis
A Cytoscape plug-in called Network Analyzer[30] was applied for the functional analysis of the genes chosen using the STRING and Cytoscape platforms. It is a flexible and easy-to-use tool for network analysis, both of biological networks and other networks. This plugin works seamlessly with Cytoscape 3.9.1 and utilizes effective graph algorithms to produce a full list of simple and complicated topological parameters. It adds node properties for the outcomes and provides helpful visualization settings to display and export the generated distributions. A few centrality measures, including degree, clustering coefficient, closeness, and betweenness centrality, were indicated.
Results
Identification of DEGs
To analyze DEGs, the dataset with series ID GSE26964 was uploaded into HCMDB. Based on fold change and P-value, 531 DEGs were determined in total. The data from GEO were cross-checked against HCMDB, which uses the limma package of R to analyze DEGs, and various plots were constructed using DEGs such as box plots, density plots, MD plots, and volcano plots using the R language [Figure 2].[31] The package of HCMDB is based on empirical Bayes values and also examined 531 miRNAs, of which 444 are downregulated and 86 are upregulated. A P-value cutoff of 0.05 and a fold change cutoff of 1 has been used.
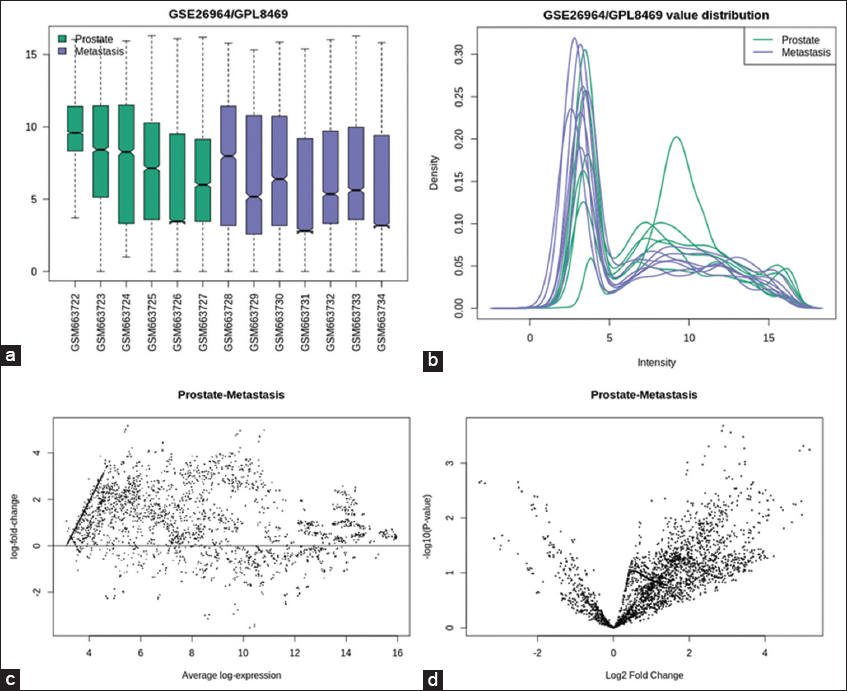
- Plots prepared by using DEGs for prostate cancer and bone metastasis to view distribution of values and visualize DEGs (a) Box plot, (b) Density plot, (c) MD plot, and (d) Volcano plot
Network construction
A PPIN[32,33] was developed to learn more about the connections between DEGs at the protein level [Figure 3]. Thirteen frequent, strongly related DEGs were used as seed genes to create an enlarged network up to the sixth growth using the STRING database [Figure 4]. Gene interaction was observed as of the sixth growth due to the maximum number of seed genes showing direct interactions. The enlarged PIPN has 53 nodes and 372 edges, which Cytoscape used to distinguish between the proposed seed genes (purple color nodes) and the additional genes added up to the sixth growth (gray color nodes) [Figure 5].
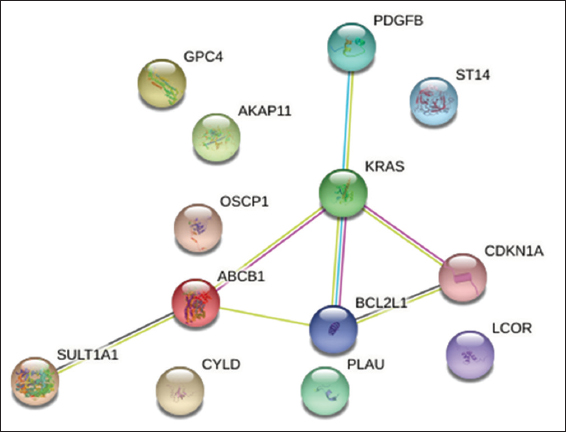
- First network of STRING representing interactions of seed genes
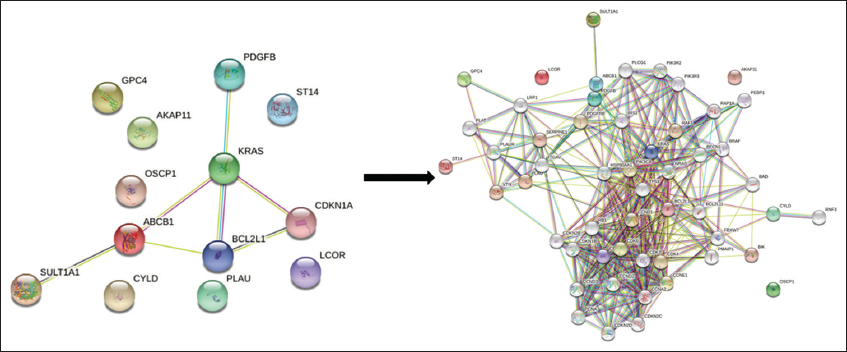
- Network extension from first network to sixth growth using STRING database
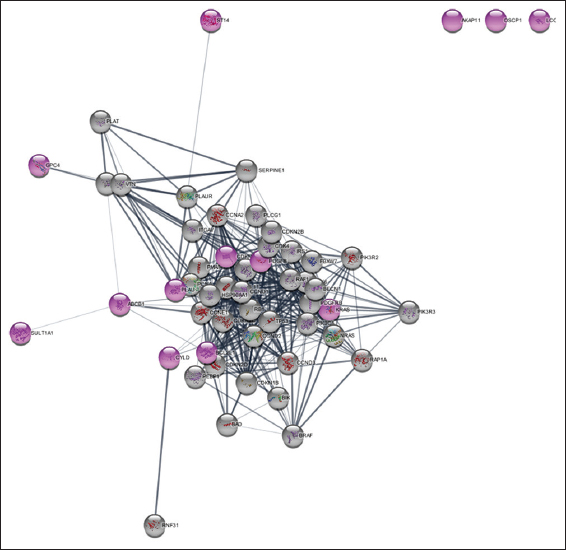
- Visualization of the network in Cytoscape (Purple color nodes: Seed genes, Grey color nodes: added genes till sixth growth)
Network and molecular profile analysis
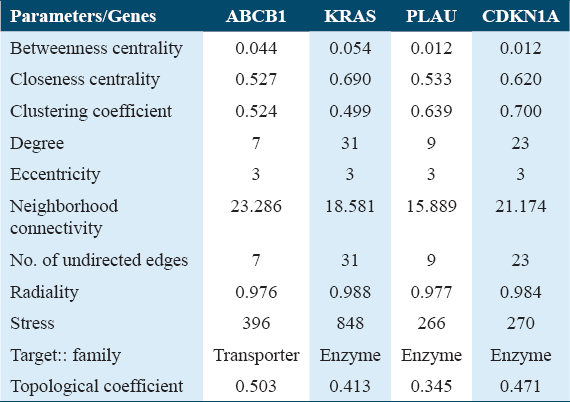
The network centrality of each node in the extended network (53 nodes) was estimated using ClusterViz, Cystoscope’s plugin, to find the hub genes.[33-35] Three of the four clusters created by ClusterViz, which was utilized to create clusters from the network, contained our seed genes [Figure 6]. Based on the centrality metrics, nodes were prioritized according to their ranking. Nodes with the highest degree were selected first, followed by other centrality parameters such as closeness, betweenness, and clustering coefficient. Based on the synthesis of all the centrality characteristics, hub genes were finally determined. The best centrality and network properties were displayed by the four genes ABCB1, KRAS, CDKN1A, and PLAU [Table 2].
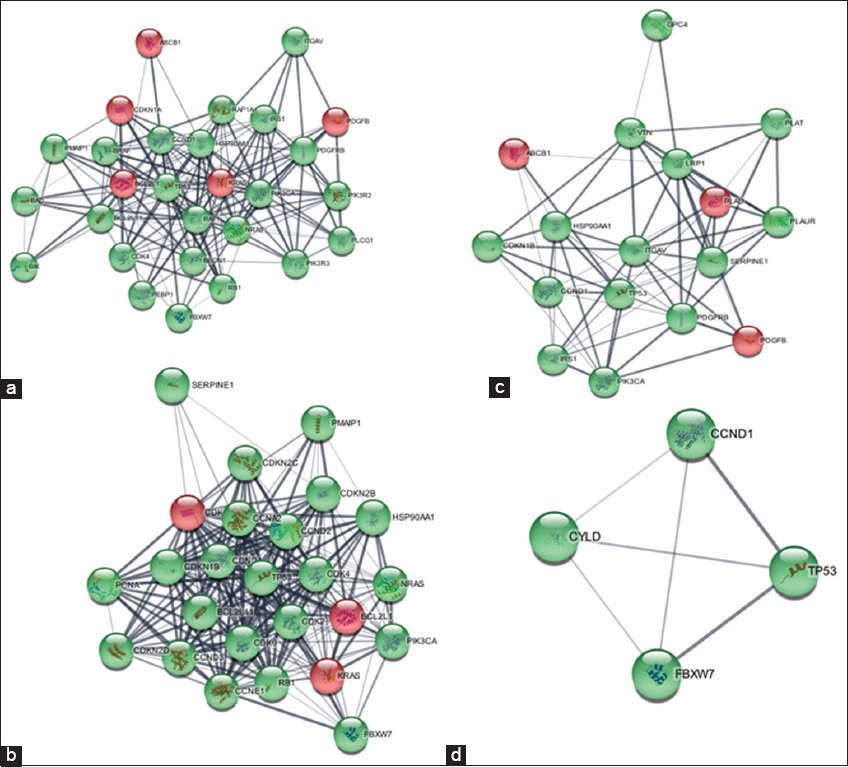
- Four Clusters (a-d) developed by ClusterViz red color nodes depict seed genes and green color nodes depict added genes.
Computation of topological parameters
A Cytoscape plug-in called Network Analyzer was used to compute several topological parameters.[36] Neighborhood connectivity, betweenness centrality, degree, topological coefficient, and closeness coefficient were the topological metrics considered [Figure 7]. In a scale-free network, the distribution of links to nodes follows a power law.[37] Power laws signify that while a small number of significant nodes (which we refer to as hubs) have a high number of connections, most nodes have extremely few connections. A power law with an exponent is frequently represented using the equation Y=MXB. X is the variable (what you can modify), Y is a function (the outcome), B is the order of scaling (the exponent), and M is a constant (unchanging).[34]
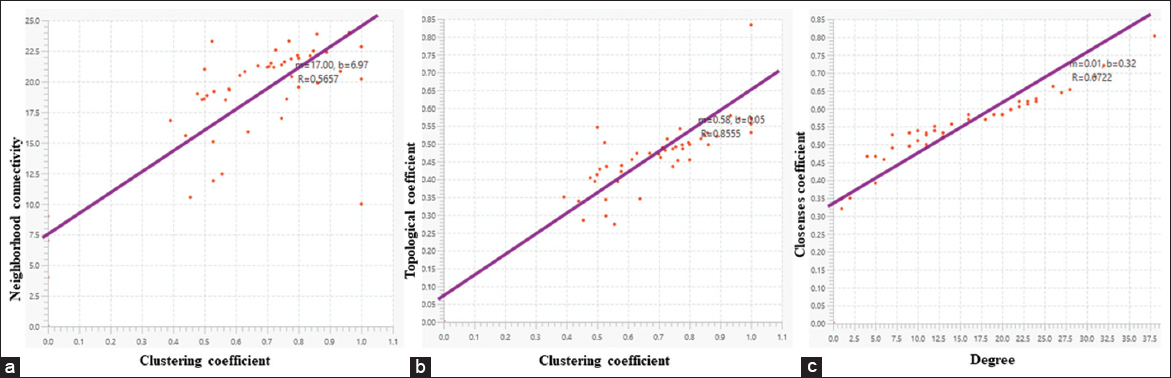
- Graph representing topological parameters using power law (a) Graph between neighborhood connectivity and clustering coefficient, (b) Graph between topological coefficient and clustering coefficient, and (c) closeness coefficient and degree
Functional characterization and pathway analysis
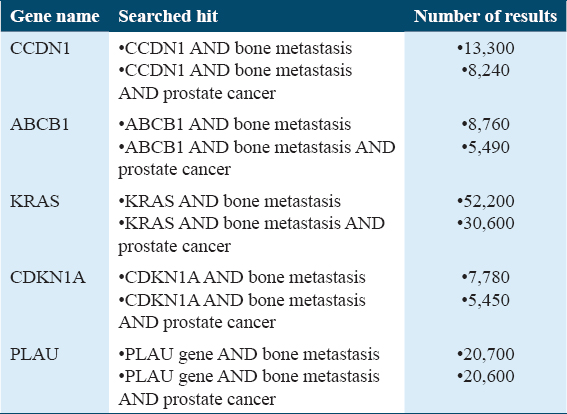
Based on gene expression, taking into consideration the P-value and logFC, the expression profiles of the four genes mentioned were analyzed [Figure 8]. CCND1 (Cyclin D1) demonstrated unique interactions with a subset of four DEGs [Figure 9]. To confirm the findings that CCND1 is the most likely target protein for bone metastases from PCa, additional Google Scholar citations using two distinct search methods were reported [Table 3]. When pathway analysis was conducted, the gene that was prominent in the Hedgehog pathway was CCND1.
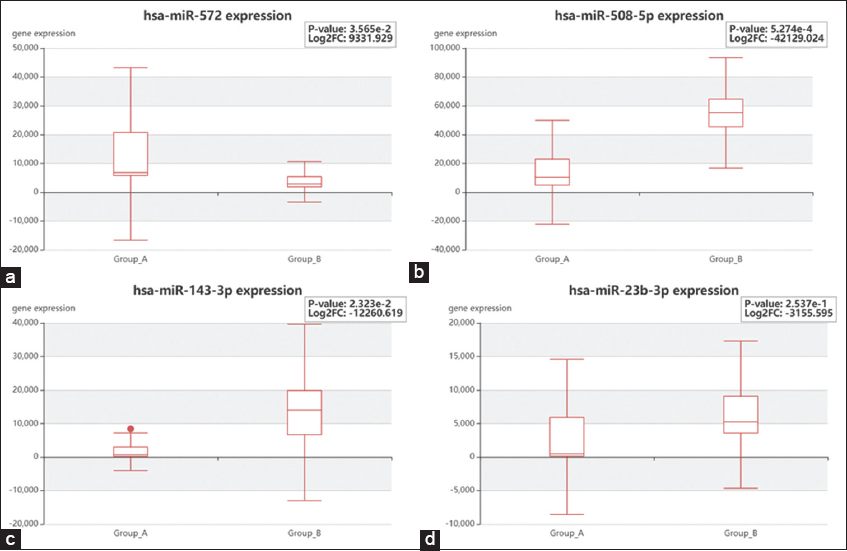
- Expression profile of four significant genes, (a) CDKN1A, (b) ABCB1, (c) KRAS, and (d) PLAU identified based on centrality parameters
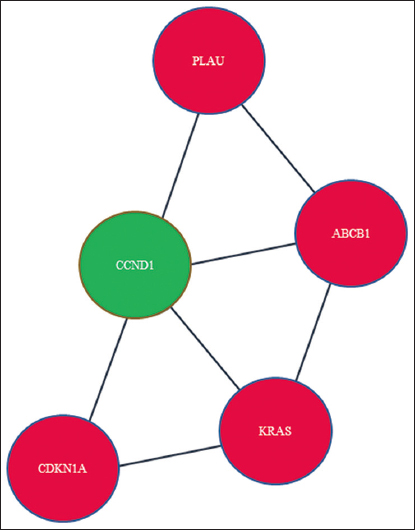
- Network between four selected DEGs (red color) and one added gene, CCND1 (green color)
Discussion
Using the GSE26964 dataset, we used a thorough bioinformatics approach in this study to uncover significant information on the molecular pathways generating bone metastases in PCa. We used information theory, MI, network analysis, and miRNA-target interactions in our investigation to pinpoint the key genes and pathways linked to this challenging disease. Identifying DEGs, which are significant in the development and onset of cancer, was the first step in our research. We identified DEGs related to bone metastases in PCa using the HCMDB. We utilized miRTarBase to identify target genes among the DEGs, shedding light on the intricate web of post-transcriptional regulation. This step allowed us to uncover potential miRNA-mediated control over gene expression[38]. The construction of gene-gene interaction networks based on DEGs offered invaluable understanding into the intricate interactions within the context of PCa metastasis.[39] For the purpose of identifying genes of significance in the network, we used centrality attributes such as degree, clustering coefficient, closeness, and betweenness centrality. Notably, ABCB1, KRAS, CDKN1A, and PLAU were identified as key actors, indicating their potential importance in the bone metastasis of PCa.[40-43] The eventual identification of CCDN1 as an additional interaction with DEGs was one of our study’s notable results. This discovery emphasizes the significance of CCDN1 in the context of PCa bone metastases, which is backed by Google Scholar citations and outcomes from numerous search techniques. Furthermore, based on the current findings, our results imply that CCDN1 may function as a significant target protein.[44] Our study showcases the utility of information theory and MI in the analysis of complex biological datasets. These techniques provided a robust framework for uncovering hidden relationships and dependencies within the data. The integration of information theory with network analysis and miRNA data allowed us to pinpoint critical targets and associated pathways. Future studies and therapeutic approaches in the area of PCa bone metastases may benefit from the knowledge obtained from this study. To establish the identified genes’ and interactions’ roles in disease progression, more experimental validation is required. The therapeutic potential of focusing on these important genes and pathways may also present interesting options for intervention. Our multidimensional analysis approach sheds light on the molecular intricacies of PCa bone metastasis. By combining information theory, network analysis, and miRNA-target interactions, we have identified candidate genes and pathways that warrant further investigation. These findings contribute to our understanding of the disease and provide a foundation for future research efforts aimed at improving the diagnosis and treatment of PCa bone metastasis.
Conclusion
In this study, we harnessed the power of bioinformatics and computational methodologies to dissect the intricate molecular landscape underpinning bone metastases in PCa, utilizing the GSE26964 dataset as our primary source of information. Employing a multi-faceted approach that integrates information theory, MI analysis, and network-based investigations, we have made substantial strides in unraveling the underlying complexities of this critical pathological process. Our analysis commenced with the identification of DEGs, a crucial step in deciphering the molecular signature of PCa bone metastasis. Leveraging the HCMDB, we rigorously identified and selected DEGs that held significant promise for further exploration. Subsequently, we delved into the regulatory realm of miRNA-mediated gene expression control by leveraging miRTarBase to elucidate target genes among the DEGs. This step provided us with invaluable insights into the post-transcriptional regulatory networks operating within the context of bone metastases. Our investigation extended to the construction of a comprehensive gene-gene interaction network, representing a dynamic view of interplay among the DEGs. Network analysis, underpinned by centrality traits such as degree, clustering coefficient, closeness, and betweenness centrality, unveiled the pivotal roles played by genes such as ABCB1, KRAS, CDKN1A, and PLAU in the regulatory hierarchy of PCa bone metastasis. These findings underscore their potential significance as key orchestrators in disease progression. Furthermore, a noteworthy discovery arose in the form of CCDN1, identified as an additional interaction with DEGs. This discovery, substantiated by Google Scholar citations and corroborated through multiple search methods, introduces CCDN1 as a pivotal player in the molecular landscape of PCa bone metastasis. Our results indicate that CCDN1 warrants serious consideration as the most likely target protein based on the insights gleaned from this study. Our study demonstrates the synergistic power of information theory, MI analysis, and graph theory, in conjunction with miRNA data, in the systematic identification of key targets and associated pathways. By taking this integrative approach, we have significantly advanced our comprehension of the molecular intricacies underlying PCa bone metastasis, providing a foundation for future research endeavors and therapeutic interventions in this critical area of oncology.
Acknowledgment
The first author (Mahima Bhardwaj) acknowledges the administration of the Vignan’s Foundation for Sciences, Technology, and Research for providing teaching assistantships during the tenure of which the present work is carried out. The authors acknowledge the Department of Biotechnology, VFSTR, for providing facilities.
Patient’s consent statement
The dataset used is secondary data that is already available in the online databases GEO), NCBI. Department of Biotechnology, VFSTR
Competing Interest
I declare any potential conflicts of interest related to the research, including financial interests or affiliations with organizations that may benefit from the publication.
Availability of Data and Materials
The data are available in an online database of gene expression data, GEO.
Authors’ Contributions
Mahima Bhardwaj: conceptualization, data collection, analysis, and writing, Thanvi Sri: Statistical analysis and literature review, Srirama Krupanidhi: Data interpretation and manuscript editing, Sachidanand Singh: Study design, data interpretation, and manuscript editing
References
- SEER Cancer Statistics Review, 1975-2012. Bethesda, MD: National Cancer Institute; 2015.
- Global cancer statistics 2018:GLOBOCAN estimates of incidence and mortality worldwide for 36 cancers in 185 countries. CA Cancer J Clin. 2018;68:394-424.
- [Google Scholar]
- Prostate cancer between prognosis and adequate/proper therapy. J Med Life. 2017;10:5.
- [Google Scholar]
- Single-cell sequencing reveals MYC targeting gene MAD2L1 is associated with prostate cancer bone metastasis tumor dormancy. BMC Urol. 2022;22:37.
- [Google Scholar]
- Targeting PPARγ signaling cascade for the prevention and treatment of prostate cancer. PPAR Res. 2012;2012:968040.
- [Google Scholar]
- Predicting the risk of bone metastasis in prostate cancer. Cancer Treat Rev. 2014;40:3-11.
- [Google Scholar]
- Prostate cancer and bone metastases:The underlying mechanisms. Int J Mol Sci. 2019;20:2587.
- [Google Scholar]
- Tumor microenvironment mechanisms and bone metastatic disease progression of prostate cancer. Cancer Lett. 2022;530:156-69.
- [Google Scholar]
- Effects of medical treatment of prostate cancer on bone health. Trends Endocrinol Metab. 2021;32:135-58.
- [Google Scholar]
- Brief overview of prostate cancer statistics, grading, diagnosis and treatment strategies. Adv Exp Med Biol. 2018;1095:1-14.
- [Google Scholar]
- The distribution of secondary growths in cancer of the breast. Lancet. 1889;133:571-3.
- [Google Scholar]
- Identification of miRs-143 and-145 that is associated with bone metastasis of prostate cancer and involved in the regulation of EMT. PLoS One. 2011;6:e20341.
- [Google Scholar]
- The altered expression of MiR-221/-222 and MiR-23b/-27b is associated with the development of human castration resistant prostate cancer. Prostate. 2012;72:1093-103.
- [Google Scholar]
- NCBI GEO:mining millions of expression profiles-database and tools. Nucleic Acids Res. 2005;33:D562-6.
- [Google Scholar]
- Biomarker microRNAs for prostate cancer metastasis:Screened with a network vulnerability analysis model. J Transl Med. 2018;16:134.
- [Google Scholar]
- Limma powers differential expression analyses for RNA-sequencing and microarray studies. Nucleic Acids Res. 2015;43:e47.
- [Google Scholar]
- miRTarBase 2020:Updates to the experimentally validated microRNA-target interaction database. Nucleic Acids Res. 2020;48:D148-54.
- [Google Scholar]
- Systematic analysis of bicistronic reporter assay data. Nucleic Acids Res. 2004;32:e160.
- [Google Scholar]
- Western blot:Technique, theory, and trouble shooting. North Am J Med Sci. 2012;4:429.
- [Google Scholar]
- The qPCR Data Statistical Analysis. 2009;1:1-9.
- STRING:A database of predicted functional associations between proteins. Nucleic Acids Res. 2003;31:258-61.
- [Google Scholar]
- Nucleic Acids Res. 2004;32:D258-61.
- RSAD2:An exclusive target protein for Zika virus comparative modeling, characterization, energy minimization and stabilization. Int J Health Sci. 2023;17:12-7.
- [Google Scholar]
- KEGG for linking genomes to life and the environment. Nucleic Acids Res. 2007;36:D480-4.
- [Google Scholar]
- Putative target identification for gout;a network biology approach. J Bionanosci. 2013;7:649-53.
- [Google Scholar]
- Computing topological parameters of biological networks. Bioinformatics. 2008;24:282-4.
- [Google Scholar]
- CXCL10 is a tumor microenvironment and immune infiltration related prognostic biomarker in pancreatic adenocarcinoma. Front Mol Biosci. 2021;8:611508.
- [Google Scholar]
- Reconstruction and application of protein–protein interaction network. Int J Mol Sci. 2016;17:907.
- [Google Scholar]
- Gene co-expression network analysis for identifying genetic markers in Parkinson's disease-a three-way comparative approach. Genomics. 2019;111:819-30.
- [Google Scholar]
- Identification of hub genes to regulate breast cancer metastasis to brain by bioinformatics analyses. J Cell Biochem. 2019;120:9522-31.
- [Google Scholar]
- Molecular modeling and network based approach in explaining the medicinal properties of Nyctanthes arbortristis, Lippia nodiflora for rheumatoid arthritis. J Bioinform Intell Control. 2014;3:31-8.
- [Google Scholar]
- Pan-genomic analysis of the species Salmonella enterica: Identification of core essential and putative essential genes. Gene Rep. 2020;20:100669.
- [Google Scholar]
- Information theory applications for biological sequence analysis. Brief Bioinform. 2014;15:376-89.
- [Google Scholar]
- Molecular signature of cancer at gene level or pathway level?Case studies of colorectal cancer and prostate cancer microarray data. Comput Math Methods Med. 2013;2013:909525.
- [Google Scholar]
- ABCB1 genetic variation influences the toxicity and clinical outcome of patients with androgen-independent prostate cancer treated with docetaxel. Clin Cancer Res. 2008;14:4543-9.
- [Google Scholar]
- Mutation status of somatic EGFR and KRAS genes in Chinese patients with prostate cancer (PCa) Virchows Archiv. 2014;464:575-81.
- [Google Scholar]
- miR-3619-5p inhibits prostate cancer cell growth by activating CDKN1A expression. Oncol Rep. 2017;37:241-8.
- [Google Scholar]
- Expression of cancer-associated genes in prostate tumors. Exp Oncol. 2017;39:131-7.
- [Google Scholar]
- MicroRNA-487a-3p functions as a new tumor suppressor in prostate cancer by targeting CCND1. J Cell Physiol. 2020;235:1588-600.
- [Google Scholar]