
Translate this page into:
A cross-tabulated analysis for the influence of climate conditions on the incidence of dengue fever in Jeddah City, Saudi Arabia during 2006–2009
Address for correspondence: Ibrahim Alkhaldy, Department of Administrative and Human Research, Umm Al-Qura University, Makkah 21955, Saudi Arabia. E-mail: iakhaldy@uqu.edu.sa
This is an open-access article distributed under the terms of the Creative Commons Attribution-Noncommercial-Share Alike 3.0 Unported, which permits unrestricted use, distribution, and reproduction in any medium, provided the original work is properly cited.
This article was originally published by Qassim Uninversity and was migrated to Scientific Scholar after the change of Publisher.
Abstract
Objective:
Increased temperature and humidity across the world and emergence of mosquito-borne diseases, notably dengue both continue to present public health problems, but their relationship is not clear as conflicting evidence abound on the association between climate conditions and risk of dengue fever. This characterization is important as mitigation of climate change-related variables will contribute toward efficient planning of health services. The purpose of this study was to determine whether humidity in addition to high temperatures increase the risk of dengue transmission.
Methods:
We have assessed the joint association between temperature and humidity with the incidence of dengue fever at Jeddah City in Saudi Arabia. We obtained weekly data from Jeddah City on temperature and humidity between 2006 and 2009 for 200 weeks starting week 1/2006 and ending week 53/2009. We also collected incident case data on dengue fever in Jeddah City.
Results:
The cross-tabulated analysis showed an association between temperature or humidity conditions and incident cases of dengue. Our data found that hot and dry conditions were associated with a high risk of dengue incidence in Jeddah City.
Conclusion:
Hot and dry conditions are risk factors for dengue fever.
Keywords
Climate
cross-tabulation analysis
dengue fever
Jeddah city

Introduction
Dengue fever remains an important infectious disease in the Middle East transmitted to people through the breeding of Aedes mosquitoes.[1,2] In the Arab world, dengue was first seen in the late 19th century.[3] The disease emerged in Zanzibar in Dar es Salaam, on the East African coast, and in Makkah, Medina, and Jeddah, Saudi Arabia.[3] Symptoms of the dengue virus can vary from having a mild fever to a severe deadly hemorrhagic fever or dengue shock syndrome.[4] Moreover, one could also experience a very high temperature, acute headache, pain in the back of the eyes, discomfort in the joints, sore muscles, and painful bones.[5] Dengue hemorrhagic fever is dengue fever accompanied with hemorrhage and includes severe pain in the abdomen, bleeding, vomiting with or without blood, black stools, and excessive thirst.[6]
The transmission of vector-borne infectious diseases is determined by many components, including climatic conditions, such as temperature and humidity.[7,8] The transmission of mosquito-borne-diseases in particular is sensitive to climate variations, as rainfall and temperature affect the density of mosquitoes.[9,10] As temperature and humid conditions help in breeding of mosquitoes, mosquitoes that carry the dengue virus have increased risk of spreading dengue under those circumstances.
Ae. aegypti – the mosquito species that spread dengue – are susceptible to extreme temperatures regardless of humidity such as dry and hot conditions or wet and hot surroundings. Ae. aegypti arvae die once water temperatures reach 34°C and adult mosquitoes start to die at an air temperature of 40°C.[11] While temperature is an important factor in the development of larval advancement, it is not the most useful predictor in regards to the larval amounts in a particular geographical region.[11-15] Other climatic factors including the hours of sunlight and wind velocity may influence mosquito survivability and ecology.[16,17]
Promprou et al. (2005), in a study of dengue fever hemorrhagic fever incidence and climatic factors of Southern Thailand, showed that while climatic variables (rain and temperature) do have a major role in the transmission cycles of dengue hemorrhagic fever, the importance of these factors differed by geographical region. The study compared the Gulf of Thailand side of Southern Thailand to the Andaman Sea side.[18] The Andaman side with 204 ± 215 mm rainfall and 80.85% humidity had a lower incidence rate of dengue hemorrhagic fever than the Gulf side, which had 183 mm of rain and 79% humidity.[18] These variations were because of the high yearly precipitation and the higher number of rainy days on the Andaman Sea side during the May to October monsoon season.[18] These findings contrasted with an earlier study by Kanchanapairoj, (2000) which concluded that the incidence of dengue hemorrhagic fever was similar in both regions.[19] The difference may be because the two studies examined different time spans (1978–1997 versus 1993–2002) and covered different areas (four provinces versus all 14 provinces in Thailand).
In a recent study conducted by Polwiang (2020), they analyzed the epidemiology of dengue and aimed to determine dengue’s seasonal patterns in Thailand and its relation to various climate factors.[20] The study also used three models to predict the incidence of dengue.[20] It was found that the seasonal factor seemed to be weaker than the trends of dengue cases, and climate factors may not be the only indicator of the transmission of dengue.(20) Moreover, it determined that using one model may not be sufficient to forecast a dengue outbreak.[20] Wang et al. (2019) also investigated the outbreak of dengue in Guangdong, China.[21] They looked at weather conditions impacting dengue through multi-scale models.[21] Unlike the Polwiang study, it found that predicting certain weather conditions including rainfall, temperature, and peaking times allowed for quick response decisions mainly due to the pauses between incidents of precipitation and the effective reproduction number of dengue fever.[21] Adnan et al. (2020) set out to determine whether dengue fever cases were related to the trend of climatic factors in Kuala Lumpur.[22] It revealed that factors such as temperature, relative humidity, and rainfall impacted 4.4% of dengue cases in the years from 2012 to 2016.[22]
The results from the epidemiological studies suggest two related issues. First, that dengue is manifested by a complex interaction between climate variables, biology of the Aedes, transmission of the disease, and geographical/spatial variation. Second, there is a lack of consistency in the pattern of association between temperature, humidity, and the risk of dengue fever across the world. Hence, there is a need to unravel the different aspects of this disease transmission and hence local and geographically small area-based studies are necessary to address specific situations. We have addressed these aspects by conducting the first ever local analysis connecting climate data and incident dengue in Jeddah. We present here the reports of the first study in Jeddah on the association between temperature and humidity conditions in Jeddah City and the prevalence of dengue fever in Jeddah City.
Like many other cities in Saudi Arabia, Jeddah City has a warm climate. Summer temperatures are rather hot and often rise above 52°C, while in winter, the temperature is a more modest 25°C.[23] There is a very little rain in this region and only a small amount of it falls in winter.[24] From 2006 to 2009, there was a low amount of rain, with 70 mm the maximum rainfall, in the winter of 2009, during week 48.[23] Because of its coastal location, Jeddah City has high humidity on most days of the year, but more especially in summer.[24] These conditions play a significant role on the population density of mosquitoes.[23,25]
The purpose of this study is to assess the association between climate variables and dengue fever cases to understand why there is a major problem of dengue fever in Jeddah City. This particular area in Saudi Arabia experiences high numbers of dengue fever cases, and it has been hypothesized that climate may have an effect on these numbers. The primary question of our study attempts to determine what effects climate factors have on dengue fever case rates and to what extent are seasonal variations in dengue. In the following sections, we present the methods, main results, and discuss the importance of the findings. In this report, we investigate the relationship between climate conditions and incidence of dengue fever in Jeddah City.
Methods
There are various methods and tools which have been implemented to explain the association between climate variables and dengue fever. The previous studies have used non-linear to describe the relationships between temperature and dengue cases.[26-28] One of this study have used the distributed lag none-linear model (DLNM) R package to examine temporal associations of primary variables of interest on dengue cases reported weekly across the maximum lag period. DLNM explains non-linear and delayed associations between climate factors and weekly dengue cases by integrating the base matrices through another cross-basis function to demonstrate the relationship at the same time.[29] In this study, we present a descriptive analysis for weekly data using cross-tabulation analysis of secondary data on climate variables and incident dengue cases in Jeddah city.
Data acquisition
We obtained the following climate-related variables from Jeddah City administration: Daily temperature, humidity, and confirmed cases of dengue between 2006 and 2009. We have analyzed data on odds week and measures of the weekly mean, maximum, and minimum values for temperature and humidity. The data covered all weeks in the period 2006–2009, which were divided into the total number of dengue fever cases per week, the weekly mean, and maximum and minimum of temperature and humidity into quartiles, ranging from 1 (lowest) to 4 (highest).
Data preprocessing and analysis
We used cross-tabulation analysis in SPSS© for the weekly dengue fever cases and temperature and humidity variables to assess the linear relationship between the total number of dengue fever cases per week with weekly average of maximum and minimum temperature and humidity.
Variations in temperature and humidity can play an important part in explaining rates of dengue fever in Jeddah City. To examine the influence of the variation in temperature and humidity variables, we ran a number of cross tabulations. We cross-tabulated the total number of dengue fever cases every week with climate variables. For every week, we obtained and calculated the mean, maximum, and minimum values for temperature and humidity. Following this procedure, to estimate the association between increment in the climate parameters and increase in the number of cases, we converted these measures into their quartile or 25th percentile values. Hence, for both the weekly count of dengue fever cases and weekly mean, maximum, and minimum values of climate variables, we had ordinal variables with the following values where the 1 was lowest and 4 was highest [Tables 1-6]. We then cross-tabulated the ordinal variables and used the Chi-square test of trend to assess their statistical significance.
Results
The results of the cross-tabulation analysis are presented in the following paragraphs and accompanying figures.
Seasonal variation
Figures 1–4 show the total number of dengue fever cases plotted weekly from 2006 to 2009. Across each of these years, the number of dengue fever cases increased in the summer season. In 2006, Figure 1 dengue cases were recorded between the spring and summer weeks and the highest number of 72 cases was in week 16. In 2007, despite a peak in week 27, overall, there were no clear seasonal variations because of the low number of dengue fever cases. Data for years 2008 and 2009 suggest increased incidence of dengue fever cases in the summer season. The highest correlations between the weekly number of cases in each year were found between 2008 and 2009 (r = 0.81) and 2006 and 2008 (r = 0.69).
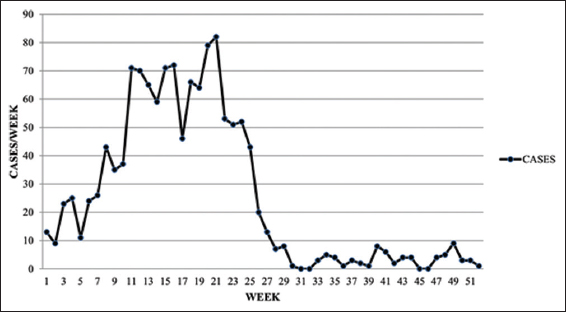
- Number of dengue fever cases per week for each week for 2006
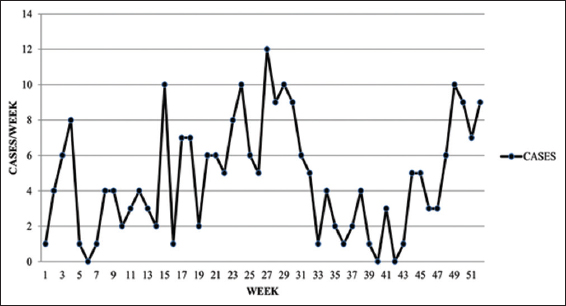
- Number of dengue fever cases per week for each week for 2007
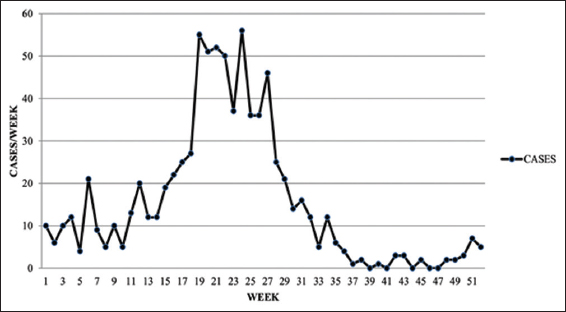
- Number of dengue fever cases per week for each week for 2008
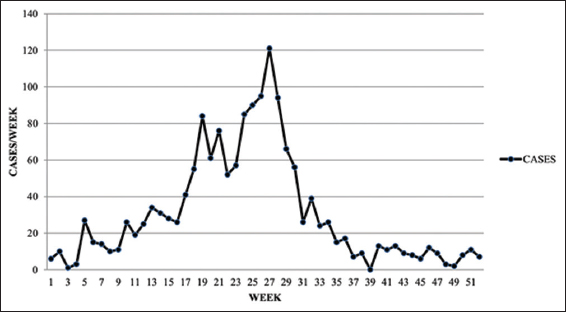
- Number of dengue fever cases per week for each week for 2009. Source: Ministry of Health, 2010
Effect of increased temperature
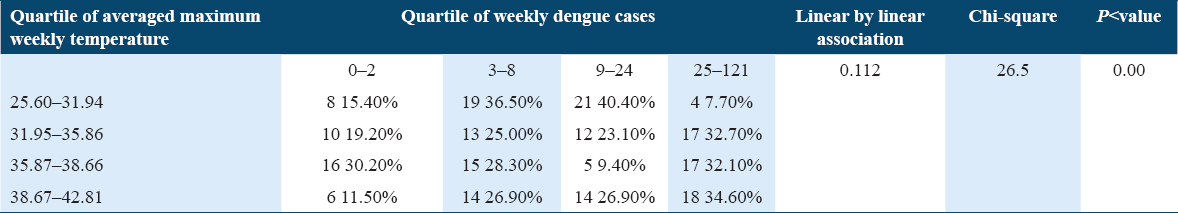
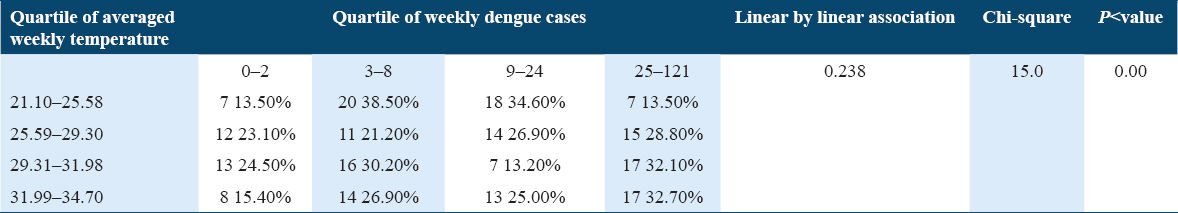
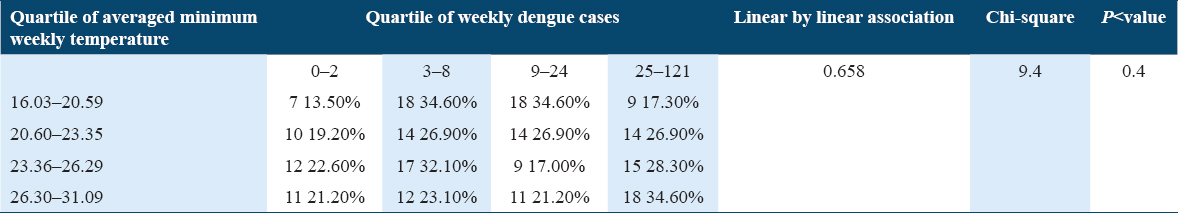
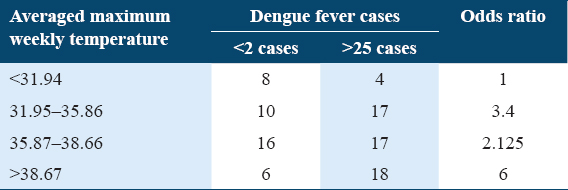
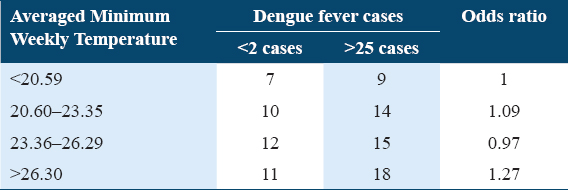
Between 2006 and 2009, the association between the weekly numbers of dengue fever cases and the weekly average of the maximum, mean, and minimum temperature suggests that the highest number of dengue fever cases occurred in the hottest weeks with the lowest humidity [Tables 7-9]. Compared with <32 degree centigrade of averaged maximum temperature, for temperatures exceeding 38 degree C, the risk of having more than 25 cases (“heavy caseload”) was higher.
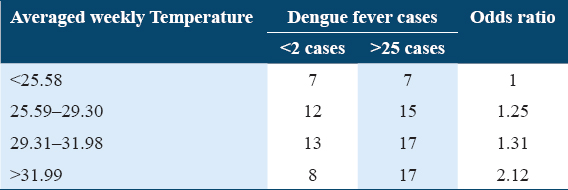
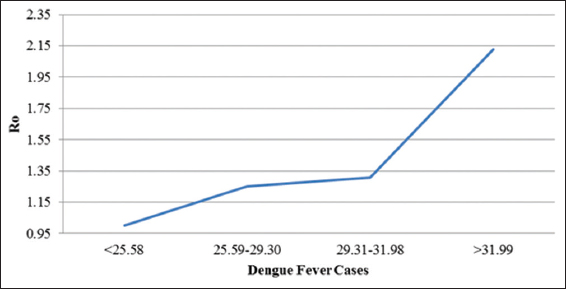
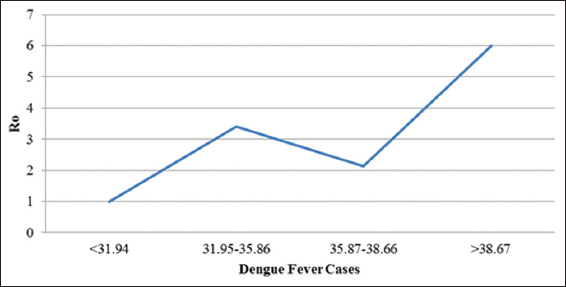
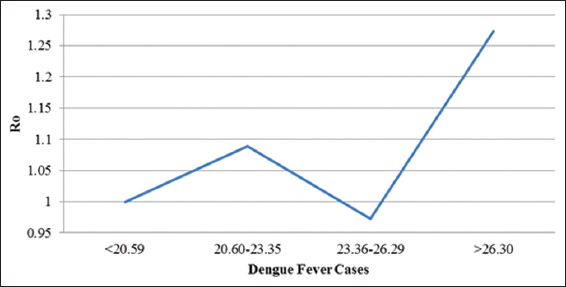
Figures 5–7 show the relationship between the weekly number of dengue fever cases and the weekly average of the mean, maximum, and minimum temperature. The weekly average of maximum and minimum temperatures was not linear with the weekly number of dengue fever cases when the average maximum and minimum temperature increased or decreased, but Figure 5 shows that the weekly average of mean temperature is significantly linear with the weekly number of dengue fever cases. This illustrates that the average of mean temperature had more effect on dengue fever in increasing the number of cases than the weekly average of maximum and minimum temperatures.
- Cross-tabulation for averaged weekly temperature and weekly and weekly dengue fever cases, 2006–2009
- Cross-tabulation for averaged maximum weekly temperature and weekly dengue cases, 2006–2009
- Cross-tabulation for averaged minimum weekly temperature and weekly dengue fever cases, 2006–2009
Effect of humidity on incident dengue fever cases
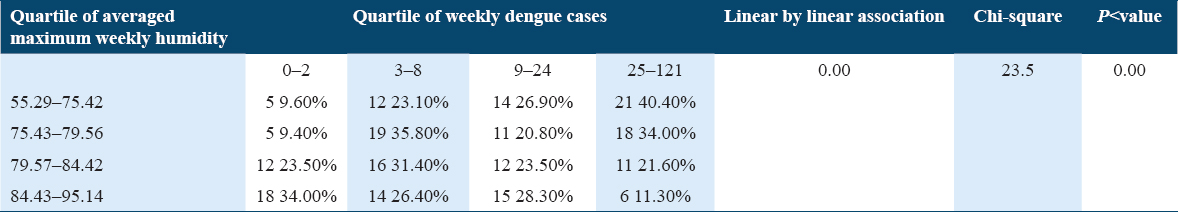
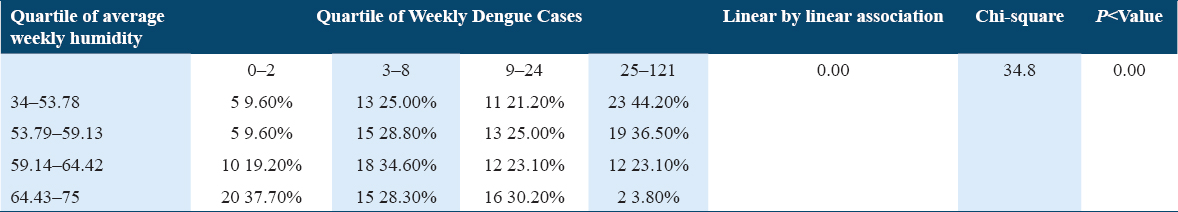
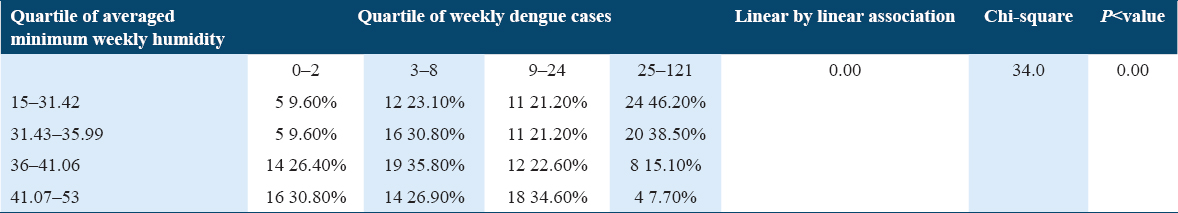
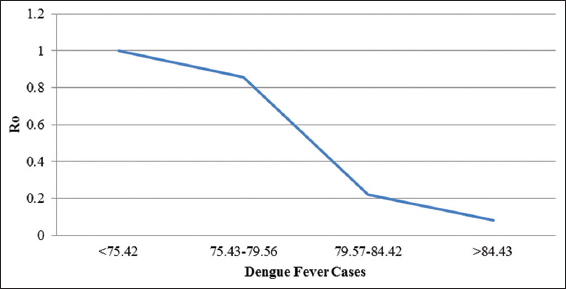
The relationship between the weekly number of dengue fever cases (2006–2009) and the weekly average of maximum, mean, and minimum humidity shows that dengue fever cases are always highest when humidity is lowest. Table 10 shows that the add ratio of having more than 25 cases was 92% less (0.08) when the averaged maximum weekly humidity was >84.43%. The weekly averages of the mean and minimum temperature relationship with the weekly numbers of dengue fever cases are located in Tables 11 and 12.
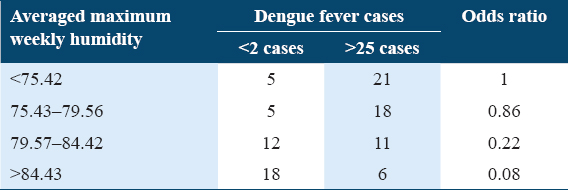
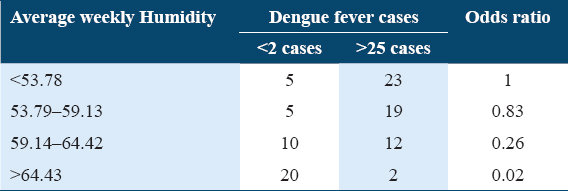
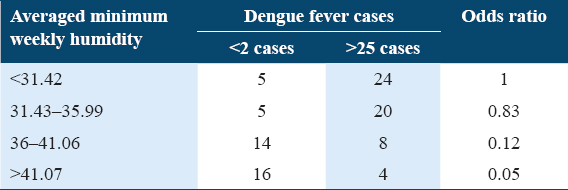
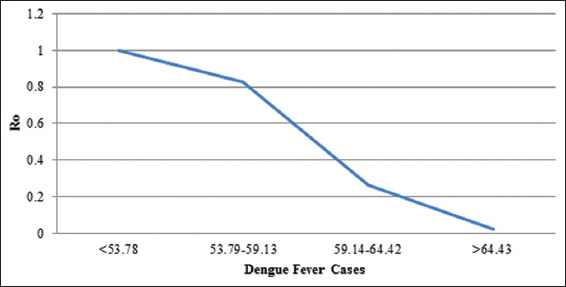
Figures 8–10 show the relationship between the weekly number of dengue fever cases and the weekly average of maximum, mean, and minimum humidity. It is evident that the weekly averages of maximum, mean, and minimum humidity were significantly linear relationships when they were increasing or decreasing.
- Cross-tabulation for averaged weekly humidity and weekly dengue cases 2006–2009

- Cross-tabulation for averaged maximum weekly humidity and weekly dengue cases, 2006–2009
- Cross-tabulation for averaged minimum weekly humidity and weekly dengue cases 2006–2009
Thus, the analyses show distinct relationships between the number of dengue fever cases and the climate variables (temperature and humidity). Weekly averages of mean temperature had a linear relationship to dengue fever cases, but this was not true of average maximum and minimum temperature. In the case of humidity, relationships were linear regardless of which measure was used.
Discussion
Analyses of the impact of temperature and humidity factors on dengue in Jeddah City showed that more dengue cases occurred when the temperature was high and humidity was low. The weekly average of mean temperature and the weekly average of maximum, mean, and minimum humidity can affect the number of dengue fever cases more than the average maximum and minimum temperatures can because they were linear statistically and significantly with dengue fever cases from 2006 to 2009. This can be considered as evidence from Jeddah regarding the association between climate variables and dengue risk. This information in itself is a valuable resources for global epidemiology.
These findings are consistent with a number of reviews of studies that have assessed the relationship between dengue fever and climatic conditions. There is consistent agreement that there is a relationship between climate and the incidence of dengue fever. For example, Banu et al. (2011) reviews a number of studies which found that climate factors were important influences on the seasonal and geographical distribution of dengue fever cases.[30]
According to Christophers (1960), the temperature and humidity in summer may have a great influence on the survival and ration of mosquitoes. Adult mosquitoes cannot survive beyond the temperature of 40°C. Kalid et al. (2008) demonstrated that high temperatures shorten the viral development rate; however, such temperatures can also increase the number of infective mosquitoes.[24]
Wu et al. (2007) studied the effects of weather variability on the occurrence of dengue fever in Kaohsiung in southern Taiwan. Using time-series analysis, dengue fever was shown to be associated with variations in temperature and rainfall.[31] Wu’s study was similar to the current research because it found temperature to be an influential factor on dengue fever.
In Jeddah City, the high temperatures and low humidity were the contributing factors. Wu’s study differed from this study in that in Southern Taiwan, rainfall is a contributing factor. This is not the case in Jeddah because the city has a very low rainfall and therefore rainfall data were not used.
We have presented here results of simple cross-tabulations and exploratory data analyses. Our analyses have several limitations. These data are at best indicative as we have only obtained aggregate level data and we did not obtain any individual level measurements, and therefore on the basis of these findings alone, it cannot be stated what would be an individual’s risk of dengue on a dry or wet hot day. Therefore, while we suggest that our study adds one more piece of evidence that increased temperature and low humidity (that is hot and dry conditions) are predisposing, risk factors for increased incidence of dengue fever, and has important public health implications, this finding needs to be validated in more carefully conducted studies and we urge caution before we can definitively recommend containment measures based on these findings.
Conclusions
This is the first study to examine the effects of climatic conditions for patterns of association between temperature, humidity, and the risk of transmitting dengue fever in Jeddah City, Saudi Arabia. While the results confirm the pattern, we expected that dengue fever can peak in dry and hot conditions as the mosquitoes breed, and dengue being an RNA virus can spread faster in hot dry conditions.[32] Besides mosquito breeding, there are possibly other contributing factors which may be responsible for the surge in dengue during the spring and summer weeks.
Authors’ Declaration Statements
Ethics approval and consent to participate
Not applicable.
Availability of data and material
The data used in this study are available and will be provided by the corresponding author on a reasonable request.
Competing interest
All authors declare no competing interests.
Funding statement
None.
Authors’ Contributions
Conceptualization, I.A. and A.B.; methodology, I.A. and A.B.; software, I.A. and A.B.; validation, I.A. and A.B.; formal analysis, I.A. and A.B.; investigation, I.A and A.B.; resources, I.A.; data curation, I.A. and A.B.; writing-original draft preparation, I.A. and A.B.; writing-review and editing, I.A. and A.B.; supervision, I.A. and P.B.; project administration, I.A. and A.B.
Acknowledgments
None.
References
- Emerging and reemerging diseases in the world health organization (WHO) eastern mediterranean region-progress, challenges, and WHO initiatives. Front Public Health. 2017;5:276.
- [Google Scholar]
- Dengue fever in Saudi Arabia:A review of environmental and population factors impacting emergence and spread. Travel Med Infect Dis. 2019;30:46-53.
- [Google Scholar]
- Gubler DJ, Kuno G, eds. Dengue and Dengue Hemorrhagic Fever:Its History and Resurgence as a Global Public Health Problem. Wallingford: Centre for Agriculture and Bioscience International; 1997. p. :1-22.
- Dengue fever and insecticide resistance in Aedes mosquitoes in Southeast Asia:A review. Parasit Vectors. 2021;14:315.
- [Google Scholar]
- 2008. Dengue and Dengue Haemorrhagic Fever. Geneva: World Health Organization; Available from: https://www.who.int/mediacentre/factsheets/fs117/en
- Climate factors and dengue fever in Jakarta 2011-2015. KnE Life Sci. 2018;4:151-60.
- [Google Scholar]
- Modelling the association of dengue fever cases with temperature and relative humidity in Jeddah, Saudi Arabia-a generalised linear model with break-point analysis. Acta Trop. 2017;168:9-15.
- [Google Scholar]
- The variability of temperature, rainfall, humidity and prevalance of dengue fever in Manado city. Bali Med J. 2022;11:82.
- [Google Scholar]
- Climate-driven variation in mosquito density predicts the spatiotemporal dynamics of dengue. Proc Natl Acad Sci U S A. 2019;116:3624-9.
- [Google Scholar]
- The Yellow Fever Mosquito. In: Its Life History, Bionomics and Structure. Cambridge: University Press; 1960.
- [Google Scholar]
- Effect of temperature on the development of Aedes aegypti and Aedes albopictus. Med Entomol Zool. 2002;53:53-8.
- [Google Scholar]
- Predicting Aedes aegypti abundance fromclimatologic data. In: Lounibos LP, Rey JR, Frank JH, eds. Ecology of Mosquitoes:Proceedings of a Workshop. Florida: Florida Medical Entomology Laboratory; 1985.
- [Google Scholar]
- Temperature-dependent development and survival rates of Culex quinquefasciatus and Aedes aegypti (Diptera: Culicidae) J Med Entomol. 1990;27:892-8.
- [Google Scholar]
- Assessing the suitability for Aedes albopictus and dengue transmission risk in China with a delay differential equation model. PLoS Negl Trop Dis. 2021;15:e0009153.
- [Google Scholar]
- The association between dengue incidences and provincial-level weather variables in Thailand from 2001 to 2014. PLoS One. 2019;14:e0226945.
- [Google Scholar]
- Climatic factors affecting dengue haemorrhagic fever incidence in Southern Thailand. Dengue Bull. 2005;29:41-8.
- [Google Scholar]
- Climatic factors influencing the incidence of dengue haemorrhagic fever in Southern Thailand. Songkhla Med. 2000;18:77-83.
- [Google Scholar]
- The time series seasonal patterns of dengue fever and associated weather variables in Bangkok (2003-2017) BMC Infect Dis. 2020;20:208.
- [Google Scholar]
- A combination of climatic conditions determines major within-season dengue outbreaks in Guangdong Province, China. Parasit Vectors. 2019;12:45.
- [Google Scholar]
- Implication of climatic factors on dengue fever in Urban area:Case study in 2012-2016. Environ Asia. 2020;13:89-102.
- [Google Scholar]
- Jeddah Climate Information. Jeddah: Presidency of Meteorology and Environment; 2011.
- Studies on identification and population dynamics of anopheline mosquitoes from Jeddah Province of Saudi Arabia. Biosci Biotech Res Comm. 2008;1:19-24.
- [Google Scholar]
- Dengue fever cases 2006-2009. In: JDFO, ed. Room. New Delhi: Ministry of Health; 2010.
- [Google Scholar]
- Statistical modeling reveals the effect of absolute humidity on dengue in Singapore. PLoS Negl Trop Dis. 2014;8:e2805.
- [Google Scholar]
- Impact of meteorological factors on the spatiotemporal patterns of dengue fever incidence. Environ Int. 2014;73:46-56.
- [Google Scholar]
- Nonlinear and delayed impacts of climate on dengue risk in Barbados:A modelling study. PLoS Med. 2018;15:e1002613.
- [Google Scholar]
- The effects of maximum ambient temperature and heatwaves on dengue infections in the tropical city-state of Singapore-a time series analysis. Sci Total Environ. 2021;775:145117.
- [Google Scholar]
- Dengue transmission in the Asia-Pacific region:Impact of climate change and socio-environmental factors. Trop Med Int Health. 2011;16:598-607.
- [Google Scholar]
- Weather as an effective predictor for occurrence of dengue fever in Taiwan. Acta Trop. 2007;103:50-7.
- [Google Scholar]