
Translate this page into:
Assessment of antipsychotic-induced cytotoxic effects on isolated CD1 mouse pancreatic beta cells
Address for correspondence: Huda A. Al Doghaither, Department of Biochemistry, Faculty of Science, King Abdulaziz University, P.O. Box (80200) Jeddah, 21589, Kingdom of Saudi Arabia. Mobile: +966505625633. E-mail: haldoghaither@kau.edu.sa
This is an open-access article distributed under the terms of the Creative Commons Attribution-Noncommercial-Share Alike 3.0 Unported, which permits unrestricted use, distribution, and reproduction in any medium, provided the original work is properly cited.
This article was originally published by Qassim Uninversity and was migrated to Scientific Scholar after the change of Publisher.
Abstract
Objectives:
The study aims to assess apoptosis, oxidative stress, and inflammation as underlying diabetogenic mechanisms in isolated CD1 mouse beta-pancreatic cells of some prescribed Antipsychotics (APs).
Methods:
Three types of APs were tested in different concentrations (0.1, 1, 10, and 100 μM) on adult male CD1 mice. The cytotoxicity of the tested APs was determined using different assays including MTT and Lactate Dehydrogenase (LDH) assays. Oxidative stress was assessed by and measuring Reactive oxygen species (ROS) production, lipid peroxidation, and antioxidant enzyme activities. Moreover, the effect on the inflammatory cascade was also investigated.
Results:
The tested APs were cytotoxic to beta cells and showed patterns dependent on both concentration and exposure, with a parallel reduction in glucose-stimulated insulin secretion of the treated cells. The APs also showed induction of oxidative stress in the treated cells by significantly increasing the ROS, lipid peroxidation, and NRf2 gene expression, together with decreased antioxidant enzyme activities. Moreover, APs showed significant increases in cytokines levels to their estimated IC50 levels. The activities of caspases 3, 8, and 9 were also significantly increased in all treated samples at their IC50s and at 10 μM concentrations of all tested APs. However, the glutathione and inhibitors of caspase-3, IL-6, and TNF-α significantly improved GSIS and the viability of the AP-treated cells.
Conclusion:
The results suggest a significant role for apoptosis, oxidative stress, and inflammation, in the diabetogenic effect of APs, expected role of antioxidants and anti-inflammatory drugs as therapeutics for improving the outcome in cases of long-term prescribed APs.
Keywords
Antipsychotic
apoptosis
diabetes mellitus
inflammation
oxidative stress

Introduction
Antipsychotic (APs) medications are widely prescribed medications for psychiatric disorders.[1,2] They are classified as old typical preparations, such as haloperidol (HAL) and chlorpromazine (CPZ), and newer atypical APs, such as olanzapine (OLZ), and risperidone (RIS) with both types having certain differences in their mechanisms of action and their common side effects and toxic manifestations.[3] Published data have reported that APs have major side effects, such as Parkinsonian-like movements, muscarinic antagonism, obesity, and diabetes mellitus (DM).[4,5]
DM is a worldwide disease with reported metabolic abnormalities and serious complications. The relationship between APs and DM was reported as early as the 1960s, but the underlying mechanisms remain obscure. Conventional APs have been reported to induce DM or aggravate already manifested cases and their complications, such as diabetic ketoacidosis.[6-8] Similar findings were reported for the newer preparations, especially CLZ and OLZ.[9-12]
Many mechanisms have been proposed to explain the diabetogenic effects of APs.[13-15] At the receptor level, AP inhibition of serotonin, dopamine, histamines, and acetylcholine muscarinic receptors was proposed to have a role in the AP-induced diabetogenic effect.[16] At the molecular level, CPZ, CLZ, and HAL inhibit glucose transport into PC12 cells in culture.[17] OLZ decreases insulin secretion and induces apoptosis in pancreatic cells.[18]
Oxidative stress mainly originates due to a disturbance in the production of Reactive oxygen species (ROS) that leads to the alterations in the activities of antioxidant systems.[19] Apoptosis has an essential role in removing damaged and infected cells and is characterized by a special biochemical sequence of events that leads to morphological changes in the cell.[20] Inflammation is a biological response of cells to irritants, including toxicants,[21] and some APs are thought to induce cytotoxic effects on different cell lines through different mechanisms. Therefore, the study aims to assess inflammation, apoptosis, and oxidative stress as potential underlying diabetogenic mechanisms of three APs (CPZ, HAL, and CLZ).
Materials and Methods
Animal and ethical considerations
This study was approved by the local Bioethics Committee of Northern Border University (RC/2022/003) upon meeting the required ethical standards related to dealing with experimental animals according to the Declaration of Helsinki. Adult male CD1 mice were selected as a source of beta cells.
Chemicals
All chemicals, unless other sources are mentioned, were purchased from Sigma-Aldrich Chemical Corporation. The stock solutions of APs were prepared in DMSO and PRMI-1640 media. Insulin concentrations were assessed using an Enzyme-linked immunosorbent assay (ELISA) kit from Crystal Chem., Downers Grove. Lactate dehydrogenase (LDH) and Caspae-3 activities were measured by assay kits purchased from Clontech Laboratories, Inc. (Palo Alto, CA). Interleukins-6 (IL-6) and Tumor necrosis factor-alpha (TNF-α) were determined using Abcam mouse ELISA kits (Cambridge, MA, USA).
Cell isolation and culture conditions
All experimental animals were immediately sacrificed under anesthesia at the completion of the experiment. Beta cells were isolated following Smelt et al.[22] The isolated cells were filtered and pre-incubated in 10 mM glucose MEM media at 37°C for an hour to increase the beta cell autofluorescence. The purity of the isolated cells was estimated as described by Clardy et al.[23]
Determination of AP cytotoxicity
The cytotoxicity of AP was determined using the MTT assay according to the manufacturer’s protocol (Promega, Madison, Wisconsin, USA). Cells were seeded at a density of 5 × 10⁴ cells/well in 96-well plastic plates and incubated overnight. APs were tested with different concentrations (0.1, 1, 10, and 100 μM) at 3, 6, 12, 24, and 48 h post-treatment. 10 μL of MTT reagent solution was added to all wells, and the cells were incubated for a further 2 h, followed by the addition of 100 μL solubilizing reagent and a further 1 h incubation. The absorbance was read at 590 nm after 30 s of medium-speed shaking. The MTT absorbance values of the blanks were subtracted from the wells. Each experiment was repeated 3 times.
Determination of cell membrane integrity using the LDH assay
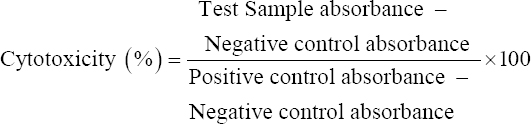
Cytotoxicity alters cell membrane integrity and causes the leakage of cellular enzymes, such as LDH, from the affected cells into the culture medium. LDH was detected in the medium using the reaction mixture provided in the kit. (Clontech Laboratories Inc., USA). Briefly, plates were prepared as described for the MTT assay, using DMSO and 2% Triton X-100 as vehicle and positive controls. At the tested time points, the plates were centrifuged at 2000 rpm for 20 min, and 100 μL of the supernatant from each well was transferred to another 96-well plate. LDH was measured by adding 100 μL of the reaction solution from the kit to the wells and incubating the cells in the dark for a further 30 min at room temperature. The absorption was then read at 490 nm. Cytotoxicity for LDH assays was calculated according to the following equation:
Detection of ROS production
ROS production was studied using DCFDA assay in MIN6 cells treated with APs. The cells were cultured and treated with APs for 24 h at their estimated IC50s using the assay described by Elmorsy et al.[24] A non-stained cell sample was used as a blank, DMSO was used as a control, and 10 mM antimycin A was used as a positive control.
Determination of oxidative stress markers
The isolated beta cells were tested with the selected APs at their estimated IC50s for 24 h. Nrf2 was assessed according to a previous protocol.[25] TBARS were quantified[26,27] and the SOD activity was determined following a previous protocol.[28] Catalase (CAT) activities were determined according to Singh et al.[29] and expressed as μmoles H2O2 consumed/min/mg of protein.[30] (Reduced glutathione (GSH) was determined according to Ullah et al.[31]
Determination of caspase levels
Approximately 1 × 10⁶ cells were grown and treated with 50, 250, and 150 μM for APs for 2 h. The assay was conducted using a fluorescent assay kit (Clontech Laboratories, USA).
Determination of inflammatory markers
TNF-α (catalog no. ab20348) and IL-6 (catalog no. ab222503) were assessed using ELISA kits (Abcam, USA). Cells were treated with APs for 24 h at the MTT-estimated IC50s and 10 μM concentrations. The color intensity was measured at 450 nm.
Quantitative polymerase chain reaction (qPCR) analysis
RNA was isolated from cell pellets using kit (catalogue no. 74104, Qiagen, USA), and then using a cDNA Reverse Transcription kit (Applied Biosystems, Thermo Fisher Scientific, Inc.), cDNA was synthesized. Quantitative PCR was performed using HotStart-IT® FideliTaq™ PCR Master Mix (2X) (catalog no. 71156, Affymetrix, USA). The effect of Aps on the expression of isolated genes families involved in the oxidative stress [Cat, SOD1 (Cu-Zn-SOD), and SOD2 (Mn-SOD)], inflammation [TNF-α and IL-6], apoptosis [Cas-3, Bax, and Bcl2] was investigated. The used primers are shown in Table 1. PCR conditions were adjusted according to Huang et al.[32] CFX96 real-time system (Bio-Rad Laboratories, Inc.) was used for the reaction. Transcript levels were calculated and normalized of the expression of the targeted genes to the expression of GAPDH (internal reference gene). Experiments were conducted in triplicates.

Determination of (GSIS)
104 cells/well were treated for 24 h with the APs at the MTT-estimated IC50s. The media was removed, and the cells were incubated in pre-warmed (37°C) serum-free, glucose-free DMEM supplemented with 2 mM L-glutamine, 25 mM Hepes (pH 7.4), and 25 mM glucose. After 15 min, the media were collected and the cells were lysed in 95% ethanol:acetic acid:concentrated HCl (75:23.5:1.5, v/v) for measurement of released insulin as well as the total cell insulin content with an ELISA kit (catalog no. 90080, Crystal Chem, Downers Grove, IL, USA).
Determination of GSH-R, cytokines, and caspase-3 inhibitor effects on AP-induced beta cell cytotoxicity
MTT and GSIS were repeated using the MTT-estimated IC50s and 10 μM concentrations for the tested APs in the presence and absence of 10 μM GSH-R, 200 μM of the caspase-3 inhibitor z-VAD-fmk, 10 μM of the IL-6 inhibitor bazedoxifene, and 150 μg/mL etanercept.
Statistical analysis
The cytotoxic effects of APs in relation to both their exposure duration and concentrations were tested using a Two-way ANOVA test. For IC50s, non-line curve fitting stats were used with variable slope model of fitting. All statistical analyses were performed using GraphPad Prism 5.0 statistical software package. For comparisons, a one-way ANOVA test was used to compare the different sets of APs data with the control nontreated samples, followed by Tukey multiple comparisons post-test and unpaired Student t-test to check for the effects of the antioxidant GSH-R, cytokines, and caspase-3 inhibitor on AP-induced beta cell cytotoxicity. Results were expressed as mean ± standard deviation with a significance level set at P < 0.05.
Results
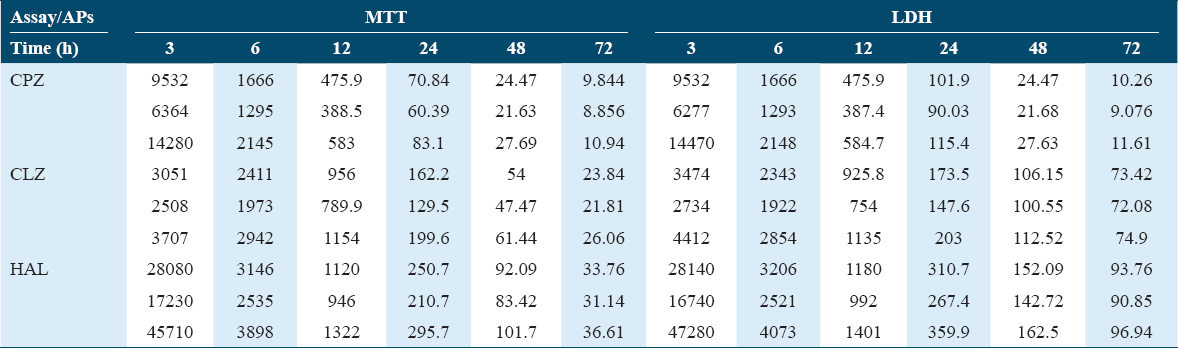
The MTT assays revealed that APs were cytotoxic to beta cells, with effects proportional to their concentrations and durations of exposure (up to 48 h) [Figure 1a-c]. No significant difference was noted in viability at any tested concentrations at 24 and 48 h with all tested APs. At a 10 μM concentration, all the tested drugs showed significant decreases in the viability of the beta cells, even after only a 6 h incubation. CPZ showed the most cytotoxic effects, while CLZ showed the safest effects, with the highest estimated IC50 [Table 2]. These findings were supported by LDH leakage, another well-established cytotoxicity assay, as the treated cells showed marked concentration-dependent and exposure duration-dependent increases in LDH leakage [Figure 1d-f].
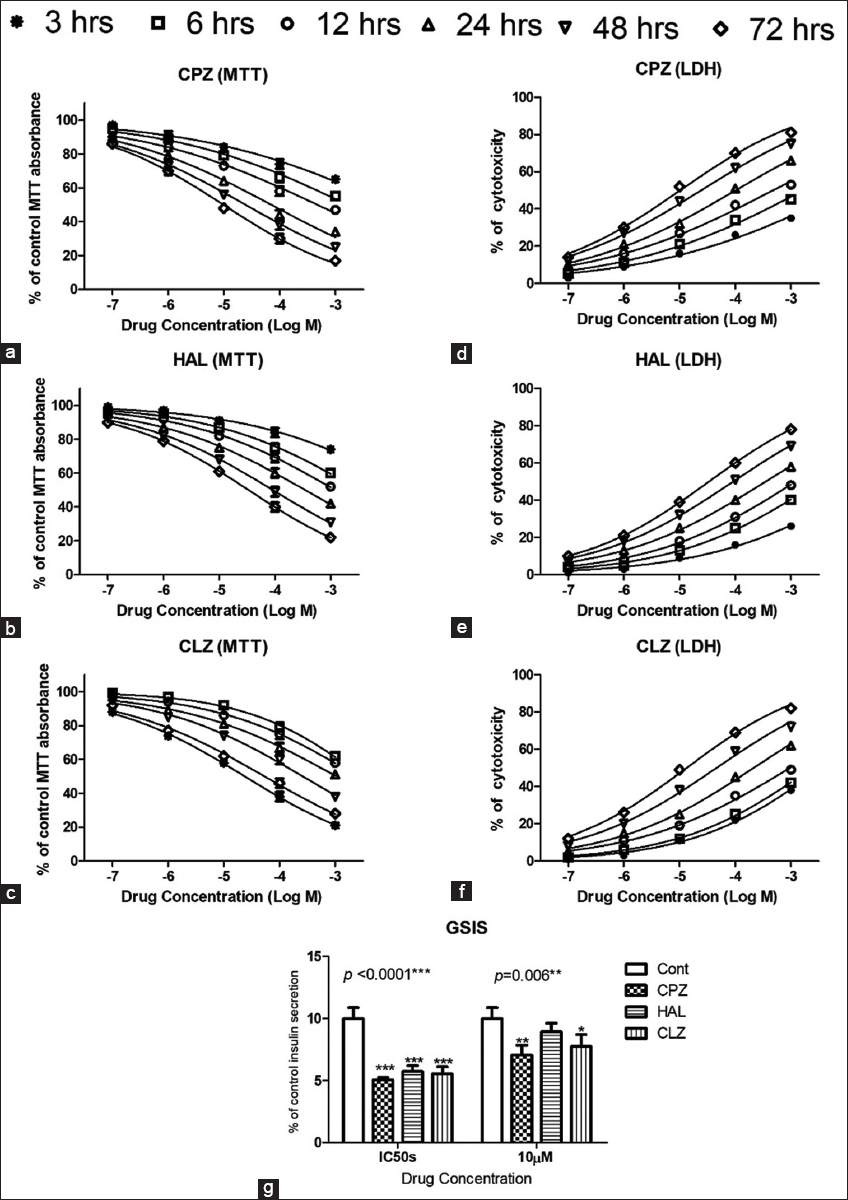
- MTT and Lactate dehydrogenase assays (a-f) showing the cytotoxic effects of the antipsychotics (APs). Different concentrations of APs were tested (0.1, 1, 10, 100, and 1000 μM) at time points 3, 6, 12, 24, 48, and 72 h post-exposure. (g) shows the effect of treatment with APs on glucose-stimulated insulin secretion by the treated mouse beta cells
All three tested APs affected insulin secretion from the pancreatic cells by significantly lowering the GSIS at 24 h post-exposure at the MTT-estimated IC50s. At a 10 μM concentration, CPZ and CLZ significantly decreased GSIS in the treated cells at 24 h after exposure [Figure 1g].
The AP-induced oxidative stress in isolated CD1 mice pancreatic beta cells was evaluated by ROS production and by other oxidative stress biomarkers, such as Nrf2 gene expression, lipid peroxidation, and antioxidant enzyme activities (i.e., CAT and SOD) and gene expression. The tested APs significantly increased ROS production determined by the DCFDA assay at 10 μM concentration and their estimated IC50s [Figure 2a], with parallel increases in lipid peroxidation TBARS end products [Figure 2b] and increased NRf2 gene expression [Figure 2c] in the treated cells compared to the controls. Interestingly, the reported oxidative stress significantly depleted the reduced glutathione stores in the treated cells [Figure 2d]. The APs significantly decreased the activities of CAT and SOD enzymes [Figures 2e and 2f], as well as their gene expression, as indicated by the qPCR data [Figures 3a-c].
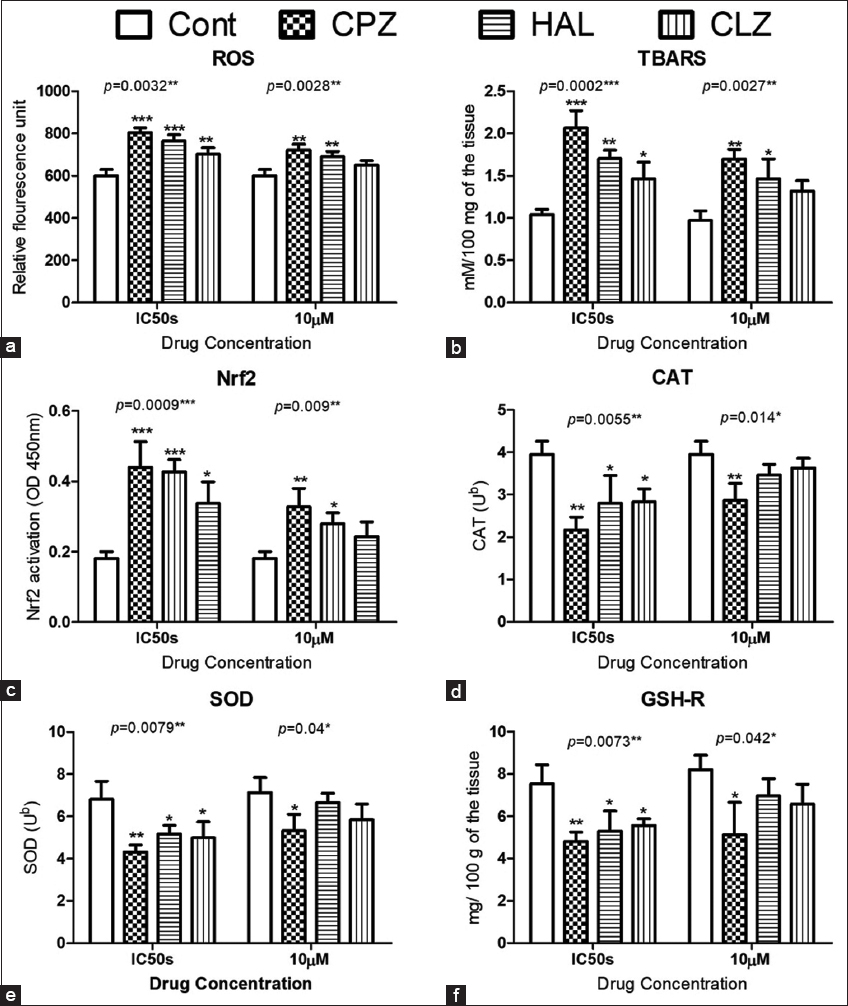
- Effect of antipsychotic (AP) on oxidative reactions in isolated CD-1 mouse pancreatic beta cells. Data show the effects on ROS production (a), lipid peroxidation (thiobarbituric acid derivatives) (b), Nrf2 gene expression (c), catalase (d), superoxide dismutase activities (e), and reduced glutathione levels (f). The Dunnett post-test was used to compare the results of the AP-treated cells to the untreated control cells. * for P < 0.05, ** for P < 0.01, and *** for P < 0.001
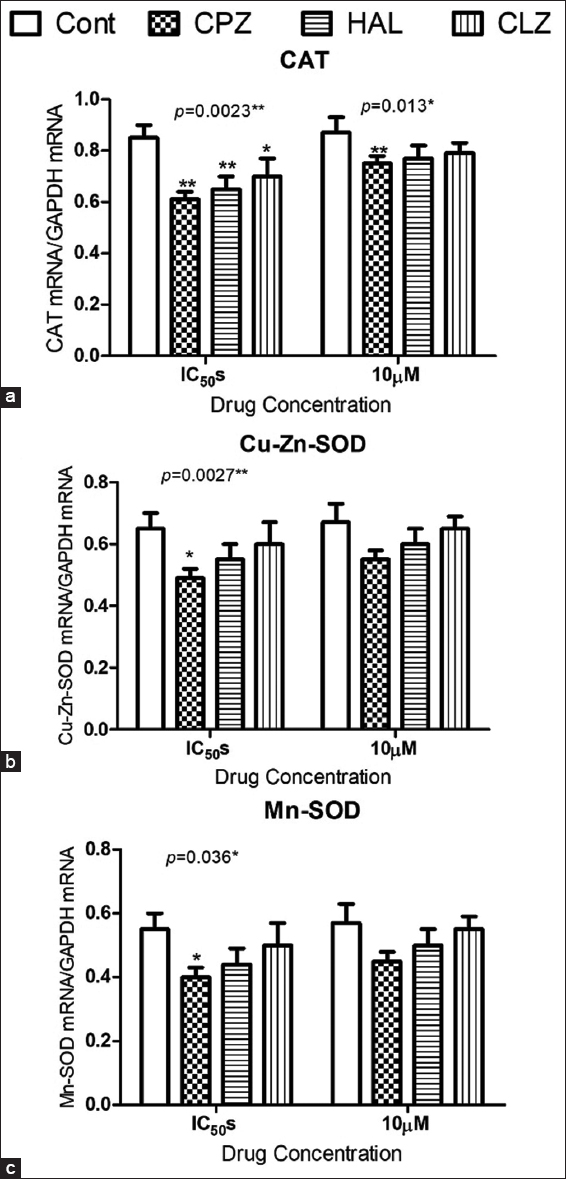
- Effect of antipsychotic administration on antioxidant gene expression in isolated CD-1 mouse pancreatic beta cells. Data show the effects on the expression of genes coding for CAT (a), SOD1 (b), and SOD2 (c). For comparing the data of the treated cells to the untreated cells, the Dunnett post-test was used. *for P < 0.05, ** for P < 0.01, and *** for P < 0.001.
The APs affected the inflammatory cascade in isolated pancreatic beta cells by increasing the concentrations of IL-6 and TNF-α, at their estimated IC50s. However, the APs had no significant effect at the 10 μM concentration [Figure 4a and b]. The qPCR and western blot data showed significant increases in the gene expression of both cytokines at the mRNA level [Figure 4c and d].
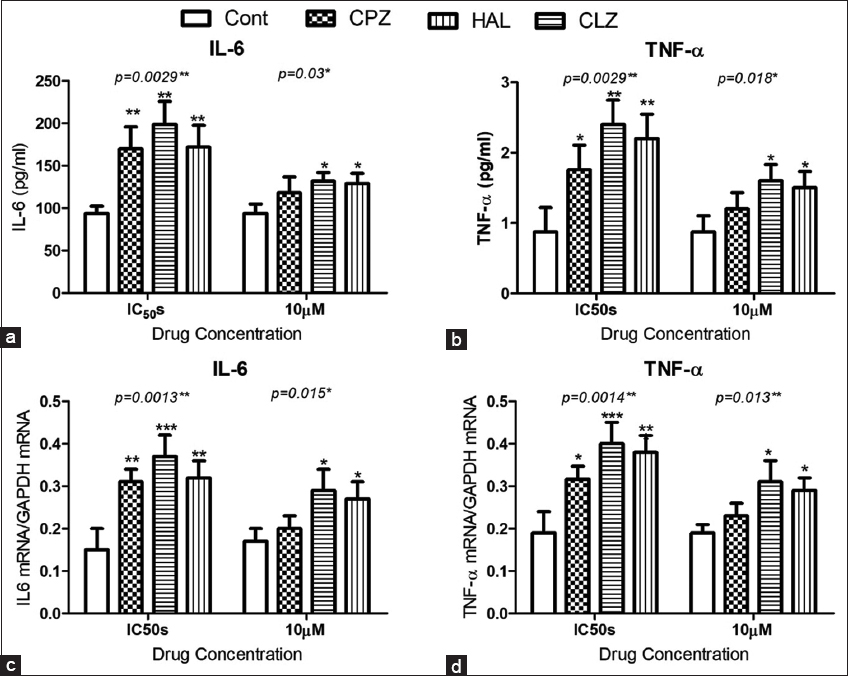
- Effect of antipsychotic administration on inflammatory cytokines in isolated CD-1 mouse pancreatic beta cells. Data show the effects on the concentrations of interleukin-6 (IL-6) (a) and TNF-α (b), and on the expression of genes coding for IL-6 (c), and TNF-α (d). For comparison between groups, the Dunnett post-test was used. *for P < 0.05, ** for P < 0.01, and *** for P < 0.001.
Caspases are well-defined markers for the induction of apoptosis. Fluorometric assays of caspases 3, 8, and 9 in isolated pancreatic beta cells revealed significant increases in caspases 3, 8, and 9 when APs were administered at their IC50s and at 10 μM concentrations. However, CLZ (10 μM) did not significantly increase caspase-9 activity [Figure 5a and b]. The fluorometric assay data for caspase activity were also supported by the qPCR and western blotting results, which both confirmed a significant increase in active caspase-3 p17 mRNA in response to AP treatment [Figure 5c and d]. As further support, as shown in Figure 6, the levels of the antioxidant GSH-R and inhibitors of caspase-3, IL-6, and TNF-α significantly improved the GSIS and viability of cells treated with APs at their estimated IC50s, whereas cells treated with APs at10 μM concentrations showed significant improvements in cell viability and GSIS when treated with the antioxidant or the caspase-3 inhibitor.
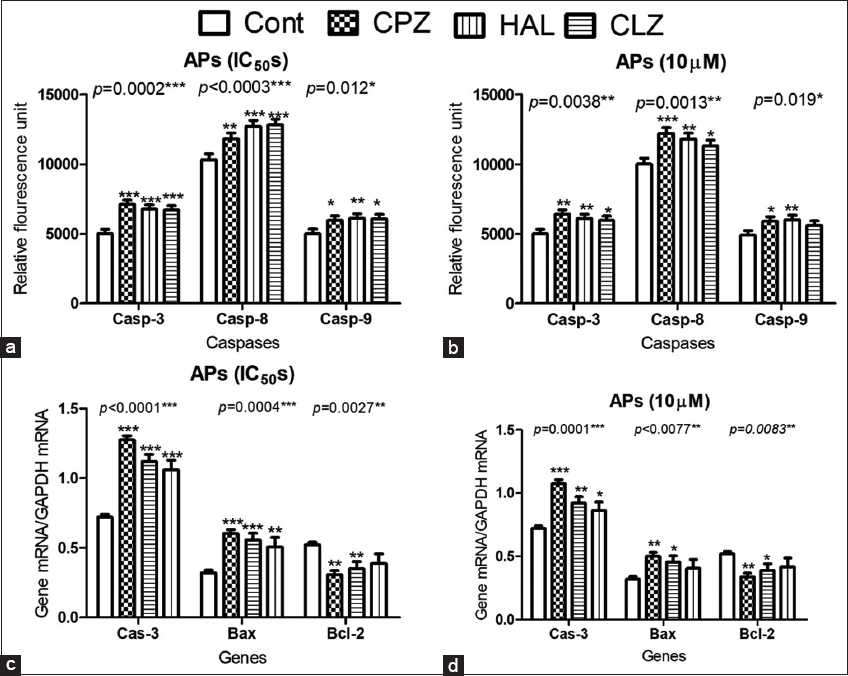
- The effect of antipsychotic (AP) administration of chlorpromazine, clozapine, and haloperidol on caspase and apoptotic gene expression in isolated CD-1 mouse pancreatic beta cells. Data show the caspase-3, -8, and -9 activities (a and b) and the expression of genes coding for cas-3, anti-apoptotic Bcl-2, and pro-apoptotic Bax genes (c and d). The Dunnett post-test was used to compare the data of the AP-treated cells to the untreated controls. *for P < 0.05, **for P < 0.01, and *** for P < 0.001
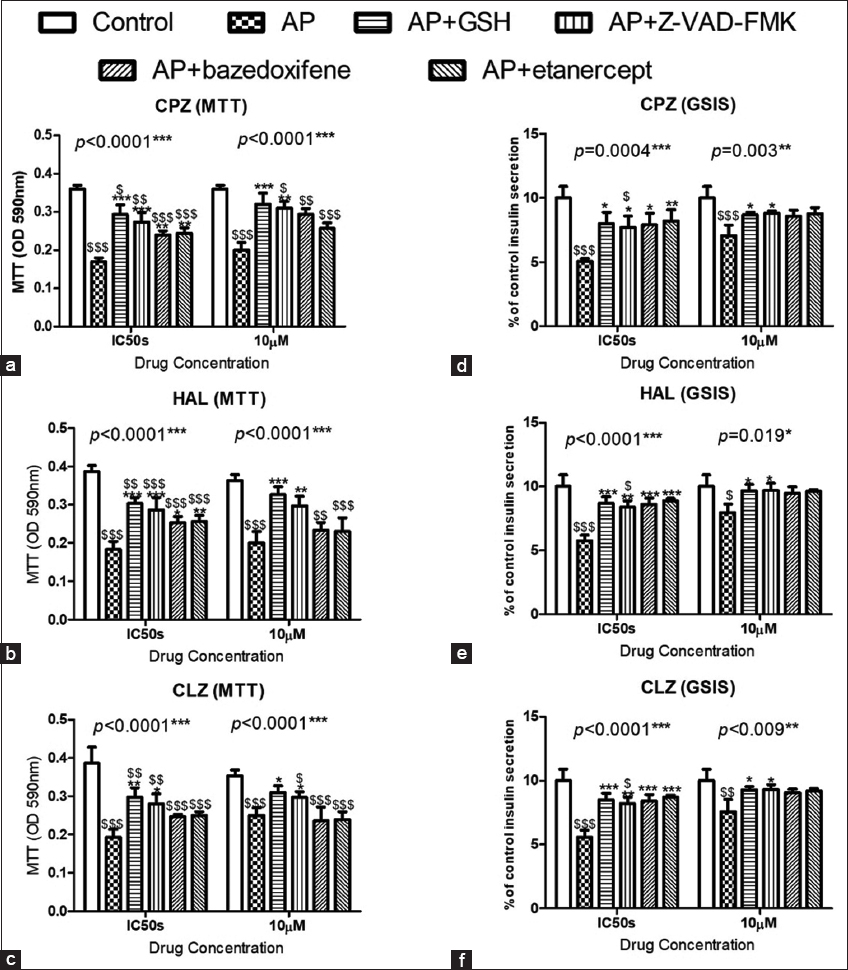
- The Effects of antipsychotics (APs) on the cell viability (a-c) and GSIS (d-f) in CD-1 mouse pancreatic beta cells. The administration of the antioxidant reduced glutathione, the cas-3 inhibitor z-VAD-FMK, the IL-6 inhibitor bazedoxifene, and the TNF-α inhibitor etanercept showed significant protective effects on cell viability and GSIS. To compare the data, the Tukey post-test was used. *for P < 0.05, **for P < 0.01, and ***for P < 0.001 for comparison between the treated samples and the other samples treated with APs in association with the protective compounds. $for P < 0.05, $$ for P < 0.01, and $$$ for P < 0.001 for comparisons between untreated control cells and the other groups
Discussion
The use of purified cells was preferred over islet cells, as the studied effect would be focused on beta cells, which are involved in insulin secretion. In addition, purification helped to avoid the effects of somatostatin. Purification was also expected to provide more homogeneous and robust data for the different experiments.
In the current study, different concentrations of APs were investigated for different reasons. One was that this range is expected to cover the therapeutic, supratherapeutic, toxic, and lethal concentrations. Blood CPZ concentrations have been reported as 1.60, 6.30, and 37.60 μM as therapeutic, toxic, and lethal blood concentrations, respectively. HAL concentrations between 0.6 and 80 μM were determined as therapeutic and toxic concentrations, while concentrations of 2.30 μM and 6.0 μM were considered therapeutic and toxic concentrations for CLZ.[1,33-35] A second reason was that this wide range was expected to cover the expected wide range of intracellular concentrations, as all three APs have ionization constants (pKa’s) >7.4 that promote higher accumulation in the relatively acidic cytoplasm.[36] In addition, the presence of halogen moieties in their molecular structures provides a greater driving force for penetrating the plasma membrane and achieving high intracellular levels.[37] A third reason was that the cytotoxic effect of APs is lower in normal cells than in neoplastic cell lines; therefore, high concentrations were used to evoke detectable effects and thus to enable the definition of the IC50s. Finally, the chronic effects of these drugs were studied using the higher concentrations of APs.
The tested APs proved cytotoxicity to beta pancreatic cells that paralleled the decrease in insulin secretion of the treated cells. Viability assays (MTT and LDH) were performed at different time points up to 72 h, as these drugs have long half-lives. AP cytotoxicity is also time-dependent, taking at least 48 h to reach the maximum effects in terms of AP effects on the cell viability. In this study, the most toxic AP was CPZ, which is mainly used for refractory schizophrenia, with the lowest IC50. The next most toxic was CLZ, whereas HAL showed a higher IC50 but was less cytotoxic. Generally, the typical APs proved to be more cytotoxic than the atypical APs, but the toxicity for PC12 cells was greater for the CLZ metabolite, desmethyl CLZ than for HAL.[38] Previously reported data for HAL effects have been contradictory, and some researchers have explained its cytotoxicity as a result of its potent neurotoxic metabolite, which resembles MPTP.[19] The current findings are also similar to the findings of the MTT assay of Dwyer et al.,[38] who showed greater cytotoxicity in PC12 cells after a 48 h treatment with CPZ and CLZ than with HAL and RIS. In normal human fibroblasts, MTT assays conducted 96 h after treatment showed cytotoxic effects of APs, with 24 h estimated IC50s of 61 μM, 310 μM, and 180 μM for CPZ, HAL, and CLZ, respectively,[39] which are within the ranges of the IC50s determined in the present work.
The current study results confirmed that APs induced apoptosis by activating the extrinsic and intrinsic pathways, with increased expression of active cleaved caspase-3 and Bax (pro-apoptotic gene); and decreased expression of Bcl-2 (anti-apoptotic gene) as triggers of apoptotic pathway activations. These findings are in accordance with those of Hieronymus et al.,[40] who showed an important role for caspases in CPZ-induced apoptosis in lymphoblasts. Similarly, Gassó et al.[41] showed that HAL can induce apoptosis in neuroblastoma SK-N-SH cells at levels of 10, 50, and 100 μM. It has been reported that CPZ, HAL, and CLZ induce apoptosis in brain microvascular endothelial cells and in isolated ovarian theca interstitial cells from albino rats.[24]
Our data also showed that APs induced oxidative stress in the treated cells to variable degrees and that reduced glutathione alleviated the cytotoxicity and altered functions caused by the tested APs. Anthérieu et al.[42] explained CPZ-induced cholestasis in HepaRG cells as an induction of oxidative stress and a release of ROS that caused the accumulation of taurocholic acid. Parikh et al.[43] showed that HAL chronic treatment increased oxidative stress, and lipid peroxidation in the brain of rats. These findings were in consist with previous reports, that showed that chronic treatment with HAL induced changes in antioxidant enzyme activities.[19] However, the effects of newer APs are contradictory. Parikh et al.[43] showed that CLZ, RIS, and OLZ did not induce oxidative stress after chronic treatment for up to 90 days, whereas Reinke et al.[44] showed that daily injections of 1.5 mg/kg HAL or 25 mg/kg CLZ for 28 days induced oxidative stress in adult male Wistar rats, but OLZ administration with different (2.5, 5.0, or 10.0 mg/kg) for the same period did not. Contreras-Shannon et al.[21] reported that CLZ-induced oxidative stress associated with altered mitochondrial inter-membrane potential in cultured cell lines, including monocytes (RAW 264.7), adipocytes (3T3-L1), hepatocytes (FL-83B), and myoblasts (C2C12), after treating the cells with CLZ at concentrations up to 75 mM for 24 h.
The current results reveal that inflammation plays a vital role in AP-induced cytotoxicity and in the reduction of GSIS levels in the treated pancreatic beta cells. This agrees with previous reports showing that inflammation has a major role in HAL-induced tardive dyskinesia through the activation of different cytokines.[45,46] Furthermore, HAL treatment at concentrations of 20, 30, and 40 μM resulted in a dose-dependent increase in the concentrations of pro-inflammatory cytokines in isolated macrophages.[47] CLZ is known to increase pro-inflammatory cytokine levels, as well as C-reactive protein levels, in the 1st month of treatment, and these changes may be warning signs of internal organ damage by inflammatory processes.[48,49] CPZ is known to inhibit inflammation in brain tissues when administered at small concentrations.[50] By contrast, CPZ caused an increase in the concentrations of cytokines in the HepaRG hepatic cell line when administered at high concentrations (50 μM) but has no significant effect when administered at a lower concentration (25 μM).[51]
Interestingly, the investigated cytotoxicity mechanisms, namely oxidative stress, apoptosis, and inflammation, were highly integrated with each other. The inflammatory cytokines play a crucial role in initiating oxidative stress in neurodegenerative diseases by increasing the reactive oxygen and nitrogen species,[52] as well as in the pathogenesis of atherosclerosis by the induction of oxidative damage and endothelial dysfunction.[53] Apoptosis is induced mainly by a class of death receptors.[54] TNF-α receptors control and initiate apoptosis.[55] Conversely, oxidative stress-activated apoptosis pathways.[56,57]
Mitochondria have a crucial role in the integration of oxidative stress and apoptosis. Mitochondria are considered the main source of ROS, as these are produced in particular following altered functions of mitochondrial complexes I and III and subsequent damage to mitochondrial and cellular lipids and genetic material. In parallel, mitochondria are the main sites of pro-apoptotic and anti-apoptotic factors that interact to determine cell survival or apoptosis.[58]
The cytochrome c release from the mitochondria is the main trigger for caspase-9 activation,[54] and mitochondria also release a second mitochondria-derived activator of caspase (Smac) and Omi, which bind to inhibitors of apoptosis and block their inhibitory effects on caspase activity.[58] In addition, the inner mitochondrial membrane contains factors that regulate the apoptosis of neuronal cells.[59] Interestingly, mitochondria appear to be the main targets of AP toxicities.[60] The imitation of study is the in vitro assays, as the biological response in the natural biological system is different from the individual isolated cells. Hence, the data require more in vivo and human study for data robustness and implementation of the findings.
Conclusion
The findings of the study support the hypothesis that apoptosis, inflammation, and oxidative stress play essential roles in the diabetogenic potential of APs. The underlying mechanisms of all three APs are highly integrated with each other, and each can induce the pathways of the others. The findings also point to the potential of assays for oxidative stress, apoptosis, and inflammation as screening tests for developing new AP preparations, for greater clinical outcomes of the future new preparations of AP. In addition, the administration of adjuvant antioxidants along with APs may decrease the risk of DM in patients undergoing prolonged AP therapy. Finally, serum amylase can be of value as a biomarker for pancreatitis in patients with DM or diabetic complications when maintained on AP therapy.
Authors’ Declaration Statement
Ethical approval and consent to participate
The local bioethics committee of Northern Border University in Saudi Arabia approved this study.
Availability of data and material
The data are available from the corresponding author on reasonable request.
Competing interests
None.
Conflict of Interests
None.
Funding
None.
Author’s contributions
HA: Study design, data analysis, and writing the manuscript. EA: Study design and conducting experiments.
References
- Efficacy, acceptability, and tolerability of antipsychotics in treatment-resistant schizophrenia:A network meta-analysis. JAMA Psychiatry. 2016;73:199-210.
- [Google Scholar]
- The role of ghrelin signalling in second-generation antipsychotic-induced weight gain. Psychoneuroendocrinology. 2013;38:2423-38.
- [Google Scholar]
- Role of dopamine D(2) receptors for antipsychotic activity. Handb Exp Pharmacol. 2012;212:27-52.
- [Google Scholar]
- Atropinic (anticholinergic) burden in antipsychotic-treated patients. Fundam Clin Pharmacol. 2018;32:114-9.
- [Google Scholar]
- Antipsychotics with similar association kinetics at dopamine D2 receptors differ in extrapyramidal side-effects. Nat Commun. 2018;9:3577.
- [Google Scholar]
- Phenothiazine-induced hyperglycemia:Relation to CNS and adrenal effects. Proc Soc Exp Biol Med. 1971;137:1385-8.
- [Google Scholar]
- Incidence of diabetes in a general practice population:A database cohort study on the relationship with haloperidol, olanzapine, risperidone or quetiapine exposure. Int Clin Psychopharmacol. 2005;20:33-7.
- [Google Scholar]
- Insulin resistance-related proteins are overexpressed in patients and rats treated with olanzapine and are reverted by Pueraria in the rat model. J Clin Psychopharmacol. 2019;39:214-9.
- [Google Scholar]
- Atypical antipsychotic drug use and diabetes. Psychother Psychosom. 2002;71:244-54.
- [Google Scholar]
- Clozapine-induced insulin-resistant hyperglycemia in a diabetic patient. Indian J Psychol Med. 2018;40:375-7.
- [Google Scholar]
- Acute onset clozapine-induced hyperglycaemia:A case report. Gen Psychiatr. 2019;32:e100045.
- [Google Scholar]
- Atypical antipsychotic drugs, schizophrenia, and metabolic syndrome in non-Euro-American societies. ClinNeuropharmacol. 2012;35:141-7.
- [Google Scholar]
- Modelling olanzapine-induced weight gain in rats. Int J Neuropsychopharmacol. 2014;17:169-86.
- [Google Scholar]
- Effects of antipsychotic medications on appetite, weight, and insulin resistance. EndocrinolMetab Clin North Am. 2013;42:545-63.
- [Google Scholar]
- Atypical antipsychotics and effects of adrenergic and serotonergic receptor binding on insulin secretion in-vivo:An animal model. Schizophr Res. 2013;146:162-9.
- [Google Scholar]
- Antipsychotic drugs affect glucose uptake and the expression of glucose transporters in PC12 cells. Prog NeuropsychopharmacolBiol Psychiatry. 1999;23:69-80.
- [Google Scholar]
- The antipsychotic olanzapine induces apoptosis in insulin-secreting pancreatic b cells by blocking PERK-mediated translational attenuation. Cell Struct Funct. 2013;38:183-95.
- [Google Scholar]
- Haloperidol cytotoxicity and its relation to oxidative stress. Mini Rev Med Chem. 2013;13:1993-8.
- [Google Scholar]
- The effect of time on apoptosis changes following ischemia-reperfusion in isolated heart of rats. Asian Pac J Cancer Biol. 2017;2:77-80.
- [Google Scholar]
- Clozapine-induced mitochondria alterations and inflammation in brain and insulin-responsive cells. PLoS On 2013:e8.:e59012.
- [Google Scholar]
- Pancreatic beta-cell purification by altering FAD and NAD(P)H metabolism. Exp Diabetes Res. 2008;2008:165360.
- [Google Scholar]
- Adverse effects of antipsychotics on micro-vascular endothelial cells of the human blood-brain barrier. Brain Res. 2014;1583:255-68.
- [Google Scholar]
- Cyclic AMP and calcium signaling are involved in antipsychotic-induced diabetogenic effects in isolated pancreatic b cells of CD1 mice. Int J Health Sci (Qassim). 2022;16:9-20.
- [Google Scholar]
- The analysis of free radicals, lipid peroxides, antioxidant enzymes and compounds related to oxidative stress as applied to the clinical chemistry laboratory. Adv Exp Med Biol. 1994;366:43-58.
- [Google Scholar]
- Review on in vivo and in vitro methods evaluation of antioxidant activity. Saudi Pharm J. 2013;21:143-52.
- [Google Scholar]
- Superoxide dismutase:Improved assays and an assay applicable to acrylamide gels. Anal Biochem. 1971;44:276-87.
- [Google Scholar]
- Comparative study of catalase-peroxidases (KatGs) Arch Biochem Biophys. 2008;471:207-14.
- [Google Scholar]
- Comparative effects of curcumin and an analog of curcumin on alcohol and PUFA induced oxidative stress. J Pharm Pharm Sci. 2004;7:274-83.
- [Google Scholar]
- Metabolic modulation of glutathione in whole blood components against lead-induced toxicity. Afr J Biotechnol. 2011;10:17853-8.
- [Google Scholar]
- Loss of LAMTOR1 in pancreatic b-cells increases glucose-stimulated insulin secretion in mice. Int J Mol Med. 2020;45:23-32.
- [Google Scholar]
- Haloperidol dose and blood level variability:Toxicity and interindividual and intraindividual variability in the nonresponder patient in the clinical practice setting. J Clin Psychopharmacol. 1995;15:334-40.
- [Google Scholar]
- A review of the use of clozapine levels to guide treatment and determine cause of death. Aust N Z J Psychiatry. 2012;46:816-25.
- [Google Scholar]
- Prediction of human volume of distribution values for neutral and basic drugs 2. Extended data set and leave-class-out statistics. J Med Chem. 2004;47:1242-50.
- [Google Scholar]
- Halogenation of drugs enhances membrane binding and permeation. Chembiochem. 2004;5:676-84.
- [Google Scholar]
- Cytotoxicity of conventional and atypical antipsychotic drugs in relation to glucose metabolism. Brain Res. 2003;971:31-9.
- [Google Scholar]
- Drugs used in the treatment of schizophrenia and bipolar disorder inhibit the replication of Toxoplasma gondii . Schizophr Res. 2003;62:237-44.
- [Google Scholar]
- Chlorpromazine induces apoptosis in activated human lymphoblasts:A mechanism supporting the induction of drug-induced lupus erythematosus?Arthritis Rheum. . 2000;43:1994-2004.
- [Google Scholar]
- Neurotoxic/neuroprotective activity of haloperidol, risperidone and paliperidone in neuroblastoma cells. Prog Neuropsychopharmacol Biol Psychiatry. 2012;36:71-7.
- [Google Scholar]
- Oxidative stress plays a major role in chlorpromazine-induced cholestasis in human HepaRG cells. Hepatology. 2013;57:1518-29.
- [Google Scholar]
- Differential effects of antipsychotics on expression of antioxidant enzymes and membrane lipid peroxidation in rat brain. J Psychiatr Res. 2003;37:43-51.
- [Google Scholar]
- Haloperidol and clozapine, but not olanzapine, induces oxidative stress in rat brain. Neurosci Lett. 2004;372:157-60.
- [Google Scholar]
- Alteration of cytokines levels in the striatum of rats:Possible participation in vacuous chewing movements induced by antipsycotics. Neurochem Res. 2016;41:2481-9.
- [Google Scholar]
- Cannabidiol prevents haloperidol-induced vacuos chewing movements and inflammatory changes in mice via PPARg receptors. Brain Behav Immun. 2018;74:241-51.
- [Google Scholar]
- Haloperidol and risperidone at high concentrations activate an in vitro inflammatory response of RAW 264.7 macrophage cells by induction of apoptosis and modification of cytokine levels. Psychopharmacology (Berl). 2016;233:1715-23.
- [Google Scholar]
- Immunomodulatory effects of clozapine and their clinical implications:What have we learned so far? Schizophr Res. 2012;140:204-13.
- [Google Scholar]
- Inflammatory response to clozapine in the absence of myocarditis:Case report. BJPsych Open. 2016;2:244-6.
- [Google Scholar]
- Chlorpromazine specifically inhibits peripheral and brain TNF production, and up-regulates IL-10 production, in mice. Immunology. 1994;82:207-10.
- [Google Scholar]
- Chlorpromazine toxicity is associated with disruption of cell membrane integrity and initiation of a pro-inflammatory response in the HepaRG hepatic cell line. Biomed Pharmacother. 2019;111:1408-16.
- [Google Scholar]
- Interrelation of oxidative stress and inflammation in neurodegenerative disease:Role of TNF. Oxid Med Cell Longev. 2015;2015:610813.
- [Google Scholar]
- Interleukin-6 induces oxidative stress and endothelial dysfunction by overexpression of the angiotensin II Type 1 receptor. Circ Res. 2004;94:534-41.
- [Google Scholar]
- Cytotoxicity induced by fine particulate matter (PM2.5) via mitochondria-mediated apoptosis pathway in human cardiomyocytes. Ecotoxicol Environ Saf. 2018;161:198-207.
- [Google Scholar]
- Ubiquitin-mediated regulation of TNFR1 signaling. Cytokine Growth Factor Rev. 2008;19:313-24.
- [Google Scholar]
- Free radicals in cross talk between autophagy and apoptosis. Antioxid Redox Signal. 2014;21:86-102.
- [Google Scholar]
- Activation of apoptosis signalling pathways by reactive oxygen species. Biochim Biophys Acta. 2016;1863:2977-92.
- [Google Scholar]
- Overexpression of appoptosin promotes mitochondrial damage in MIN6 cells. Mol Med Rep. 2018;17:7149-55.
- [Google Scholar]
- Bioenergetic disruption of human micro-vascular endothelial cells by antipsychotics. Biochem Biophys Res Commun. 2015;460:857-62.
- [Google Scholar]