
Translate this page into:
Assessment of the low-field magnetic resonance imaging for the brain scan imaging of the infant hydrocephalus
Address for correspondence: Qaim Mehdi Rizvi, Shri Ramswaroop Memorial College of Engineering and Management, Lucknow, Uttar Pradesh, India. E-mail: sirqaim@gmail.com
This is an open-access article distributed under the terms of the Creative Commons Attribution-Noncommercial-Share Alike 3.0 Unported, which permits unrestricted use, distribution, and reproduction in any medium, provided the original work is properly cited.
This article was originally published by Qassim Uninversity and was migrated to Scientific Scholar after the change of Publisher.
Abstract
Objective:
In today’s global clinical settings, low-field magnetic resonance imaging (MRI) technology is becoming increasingly prevalent. Ensuring high-quality image acquisition is crucial for accurate disease diagnosis and treatment and for evaluating the impact of poor-quality images. In this study, we explored the potential of deep learning as a diagnostic tool for improving image quality in hydrocephalus analysis planning. This could include discussions on the diagnostic accuracy, cost-effectiveness, and practicality of using low-field MRI as an alternative.
Methods:
There are many reasons which are going to affect infant computed tomography images. These are spatial resolution, noise, and contrast between the brain and cerebrospinal fluid (CSF). Now, we can enhance using the application of deep learning algorithms. Both improved and down quality were situated to the three qualified pediatric neurosurgeons comfortable with working in poor- to middle-level income countries for the analysis of clinical tools in the planning of the treatment of hydrocephalus.
Results:
The results predict that a picture will be classified as beneficial for hydrocephalus treatment planning, according to image resolution and the contrast-to-noise ratio (CNR) between the brain and CSF. The CNR is significantly improved by deep learning enhancement, which also improves the apparent likelihood of the image.
Conclusion:
However, poor-quality images might be desirable to image improved by deep learning, since those images will not offer the risk of confusing facts which could misguide the decision of the analysis of patients. Such findings support the newly introduced measurement standards in estimating the acceptable quality of images for clinical use.
Keywords
Brain imaging
comparative modeling
deep learning
hydrocephalus
neuroimaging

Introduction
Childhood hydrocephalus is the most frequent pediatric illness needing neurosurgery globally, with an estimated 400,000 new cases each year.[1] The majority of incidents, more than 90%, occur in LMICs, or low-and middle-income countries.[1] The disease affects over 180,000 infants in sub-Saharan Africa each year.[2-4] In newly born with hydrocephalus, the head enlarges due to an accumulation of intracranial cerebrospinal fluid (CSF). To arrange surgery for these infants, intracranial imaging is necessary. Knowing where the CSF is located in the brain and how many loculated compartments where fluid is trapped is crucial for planning surgery. It is necessary to have imaging technology that can accurately depict the contrast between the brain and CSF. We earlier suggested that a voxel size approaching 100 mm3 (eg. 3 × 3 × 10 mm3) could be enough to set treatment plans.[1]
The soft tissue and fluid that are contained in the skull can only be imaged to a limited extent on the brain. The acoustical windows of the fontanels are only open during the 1st year of life due to skull fusion; for this much, ultrasound is only effective. The risks associated with ionizing contamination from computed tomography (CT) scans for infants can vary depending on factors such as the dose of radiation, frequency of exposure, and the infant’s age. Infants who undergo CT scans may be at higher risk of radiation-related complications due to their increased sensitivity to radiation, as their organs and tissues are still developing. The potential dangers may include an increased risk of developing cancer later in life, potential damage to developing organs, and an increased risk of other long-term health effects. Thus, the ionizing contamination associated with CT poses very high dangers to infants;[5] though, in the subarea of Saharan Africa, CT is more dominant than magnetic resonance imaging (MRI) (according to a 2011 report by World Health Organization) due to its cheap cost. Although MRI is the gold standard for pediatric neuroimaging, high-field cryogenic systems are unaffordable for the majority of the developing world due to their high cost, stringent siting requirements, and demanding maintenance schedule;[6,7] (World Health Organization, 2011).
Uganda has 0.45 CT machines per million people and only 0.08 MRI machines, based on a World Health Organization baseline country study on medical equipment done in 2014. In comparison with a financially strong country like the Netherlands has only 12 CT as well as 12 MRI machines for a million people, almost 27 times more CT machines per million people and 150 times more MRI machines per million people. There are more new instances, with at least 10 times more per year, of hydrocephalus each year in Africa than in Europe,[1] so there is a strong clinical need for internationally sustainable diagnostic imaging technologies. According to the current research,[8] low-field MRI equipment is affordable for the poor world and has the potential to diagnose and cure conditions and manage illnesses such as hydrocephalus.
The quality of an MRI image is ultimately determined by the signal-to-noise ratio (SNR) per voxel, which reflects the balance between the signal strength and the presence of noise. Voxel sizes as small as hundreds of micrometres can be pushed by systems with higher field strengths (>1.5 Tesla), which also cause an increase in signal-to-noise.[9,10] The possible voxel size is constrained by poor signal-to-noise in low-field systems (<0.1 Tesla), which also includes higher baseline noise than is typical for physicians. There are some facts and figures which are helping the authors view the presence of comorbidities or patient factors: Some medical conditions or patient factors, such as patient motion, metallic implants, or obesity, can introduce artifacts and affect the quality of MRI images, leading to increased baseline noise. If the physicians are interpreting MRI images of patients with such comorbidities or factors, it could result in higher baseline noise in their readings. It is important to note that higher baseline noise in MRI readings can potentially impact the accuracy and reliability of the interpretations.
In above Figure 1, the primary distinctions in brain picture quality between a high-field [Figure 1a] and low-field [Figure 1b] MRI system is depicted.
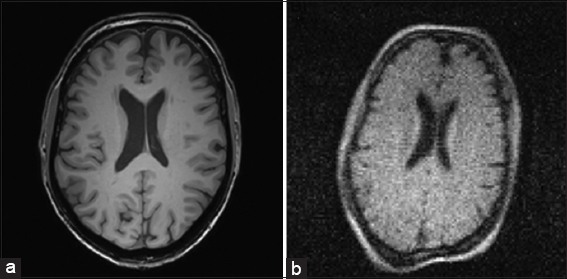
- (a and b) Here is a comparison of the two high-quality images taken at the medical center of the same volunteer’s brain, one in high-field and the other in low-field
The long-standing and lately expanding body of evidence showing increased image quality does not always translate into better diagnostic accuracy or patient outcome is a major factor in the adoption of low-field MRI into clinical practice.[11] For many illnesses in clinical practice, there is an image quality threshold over which no further outcome-based value may be seen.[2,12] Outcome-based value refers to a concept or approach where the value of a product, service, or intervention is assessed based on its outcomes or results, rather than solely on its inputs or outputs just like health-care products such as MRI machines. It focuses on the actual impact or effectiveness of an intervention in achieving its intended outcomes, rather than just evaluating the inputs or outputs of the intervention. Multiple sclerosis, hepatic lesions, and central nervous system disorders have all been shown to respond to 0.5 Tesla MRI as accurately as 1.5 Tesla MRI in terms of diagnosis.[13,14] In addition, it has been demonstrated that a 0.064 Tesla MRI can achieve diagnostic precision comparable to that of a 1.5 Tesla MRI for neoplasms and white matter disorders. We expected that the amount of resolution, tissue contrast, and SNR supplied by CT or high-field MRI significantly exceeds this threshold, even though the minimum picture quality needed to plan an effective hydrocephalus therapy has not yet been investigated. Super-resolution augmentation of subpar MRI images has already been carried out using a variety of machine learning-based techniques.
Although interpolation-based techniques are straightforward to use, they frequently blur because they lack prior knowledge.[15] Model-based approaches[16,17] investigate the mechanism of the stochastic in the process of generating the MRI and model it with prior knowledge, although it can be difficult to build a suitable regularization for the model. The benefit of learning-based approaches is that they can model and learn how to convert poor-quality images into excellent-quality images just from data.[18] Nowadays, deep learning displays outstanding work in MRI of high resolutions.[19]
In this study, we evaluate and focus on the diagnostic value of deep learning-enhanced and low-quality pictures for hydrocephalus treatment planning. We concentrate on the post-infection of newborn hydrocephalus, which is the most prevalent kind in the partial region of Saharan Africa.[19-21]
As far as it is concerned to the outside region of the LMIC, the problem is quite uncommon LMIC,[1] and CT scans are the only source of many high-resolution comparison pictures. Three senior neurosurgeons with substantial experience treating and managing hydrocephalus in low-resource settings completed an image usefulness assessment that we devised.[15,21,22]
To categorize the images, it discusses the categorization of images related to hydrocephalus treatment planning based on their resolution, noise, and contrast between brain and CSF. It mentions the use of qualitative and quantitative metrics to assess the utility or usefulness of these images. In addition, it mentions the potential for misleading changes in low-resolution images during the improvement process using machine learning.
In the context of hydrocephalus treatment planning, medical images such as MRI or CT scans are commonly used to visualize the brain and CSF. These images need to meet certain quality thresholds in terms of resolution (i.e., clarity), noise (i.e., interference or distortion), and contrast (i.e., the difference in brightness or intensity) between brain tissue and CSF to be useful for accurate diagnosis and treatment planning.
Qualitative and quantitative metrics are employed to evaluate the quality of these images. Qualitative metrics involve subjective assessments made by human experts, such as evaluating the overall image quality, presence of artifacts, and visual clarity. Quantitative metrics, on the other hand, involve objective measurements, such as SNR, contrast-to-noise ratio (CNR), or structural similarity index, which provide quantitative measures of image quality.
The statement also mentions the potential for misleading changes in low-resolution images during the improvement process using machine learning. This refers to the use of machine learning techniques, such as image enhancement algorithms, to improve the quality of low-resolution images. While these algorithms can enhance the visual appearance of low-resolution images, they may also introduce artifacts or distortions that can be misleading, affecting the accuracy of diagnosis or treatment planning. Therefore, it is important to carefully validate the results of machine learning-based image enhancement methods to ensure that they do not lead to misleading changes in the images.
Methods
As participants in the image utility assessment, three skilled pediatric neurosurgeons with experience in LMIC and expertise in the interpretation of images of African newborns with post-infectious hydrocephalus were chosen. The CURE Children’s Hospital of Uganda treated 90 individuals with post-infectious hydrocephalus, with a median age of 3.1 months and a female gender percentage of 39%.
Each patient’s center-most image slice was chosen on a random basis from the test image (10 randomly selected as described in [Figure 2]) or an image collection from the learning library for the assessment (remaining 80). The collection of images has a resolution of 0.4 mm and is 512 × 512 (20.48 cm field of view). It is 5 mm thick on each slice.
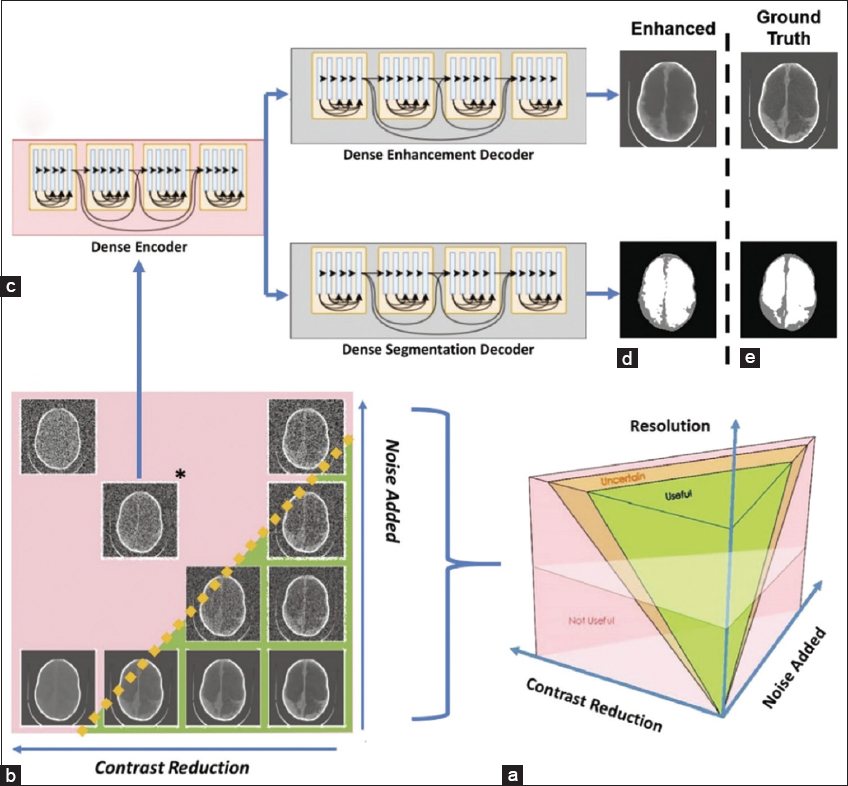
- (a-e) The image parameter space describing all possible combinations of noise, the contrast between brain and CSF, and image resolution are visualized. There is likely to be a region of parameter combinations yielding images which are useful for hydrocephalus treatment planning (green volume), a region of parameter combinations that are not useful (pink volume), and a region of uncertainty in between (orange volume)
The resolution, noise, and contrast between the brain and CSF in the ten test images all declined. The resolution was changed by changing the image’s matrix size because the field of view was consistent throughout all photos. Due to this connection, in the current work, we use the term “resolution” to refer to variations in image matrix size. As seen in Figure 2, an image parameter space was created using the following variables: There are 1,600 different parameter combinations based on the following factors: contrast reduction in the image (20 levels between 0 and 1) then having the resolution (32 × 32, 64 × 64, 128 × 128, 512 × 512), and finally the addition of noise (20 levels between 0 and 1).
Bilinear interpolation was used to downscale the resolution from the original 512 × 512 images. Bi-linear interpolation’s pixel averaging can be viewed as an approximation of the partial volume effect.
A method created especially for this task, histogram compression, was used to lessen the contrast between the brain and CSF. To simulate a reduction in tissue contrast, histogram compression iteratively reduces the brain and CSF’s histogram of gray-scale values into a narrower gray-scale bandwidth. In accordance with the known noise properties of CT scans, Gaussian noise with a mean equal to variance was applied.[23]
To depict both useful and useless images, the noise produced was scaled by clinical inspection at each resolution because lower-resolution images are more sensitive to noise. The noise variance added was scaled by resolution as follows and normalized to the maximum value: from 0 to 0.001 (32 × 32), 0 to 0.01 (64 × 64), 0 to 0.05 (128 × 128), and 0 to 0.13 (512 × 512).
These papers having the idea used deep learning networks to improve low-quality images by utilizing low-rank structural prior knowledge.[24-26] Using this work as a foundation, we created a deep learning network that can concurrently enhance and segment data CT pictures of infants with intentionally deteriorated hydrocephalus.
To improve low-quality CT images, a single encoder dual decoder architecture was applied, which was modeled after the DenseNet network discussed in.[11,27] Deep learning networks were trained using library pictures at two resolutions (64 64 and 128 128) at seven locations in parameter space, as shown in Figure 2. Networks were trained for both resolutions at (1) (0.3, 0.3), (2) (0.6, 0.3), (3) (0.3, 0.6), (4) (0.6, 0.6), (5) (0.9, 0.6), (6) (0.6, 0.9), and (7) (0.9, 0.9) with noise introduced as the x-coordinate and contrast reduction as the y-coordinate. Network 1 is the least damaged. At each of the 14 network locations, 80 library images were degraded to build the networks, which were then trained using the original, undeleted image as the ground truth. Following training, the network locations degraded the 10 test images and enhanced them, creating 140 deep learning-enhanced images.
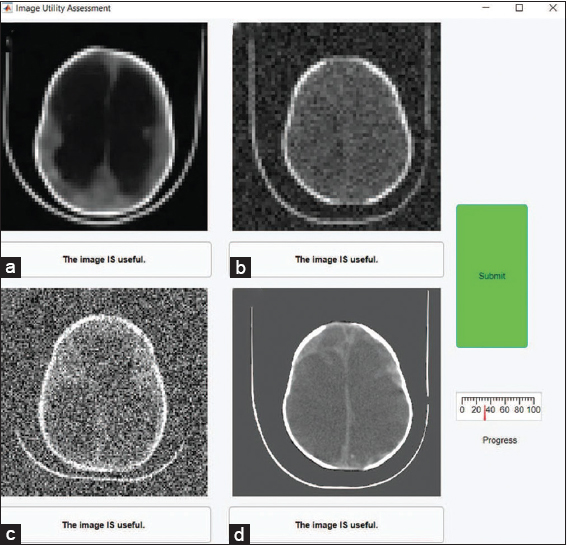
The panel of experts received all 140 deep learning-enhanced photographs and 420 cases at random from the 1,600 parameter combinations applied to the 10 test images. The evaluation of the image’s utility was split into two sections. 140 panels of four photos each were used to display the images in Part 1 as illustrated in Figure 3a. One improved image location and three degraded image locations were randomly chosen for each of the 140 panels. The existence of improved photographs was not disclosed to the expert. The expert in each panel was asked to decide which, if any, of the four photos was clinically helpful for formulating a treatment strategy for hydrocephalus (see Supplementary Methods for full instructions). By summing the scores for each image to be classed as useful, uncertain, or not useful, the data from the three experts were integrated. An image scored a 3 if it was deemed beneficial by all three experts (i.e., Useful). 0 was given to an image if all experts concurred that it was not used (i.e., Not Useful). Images that were unclear either scored a 1 or a 2.
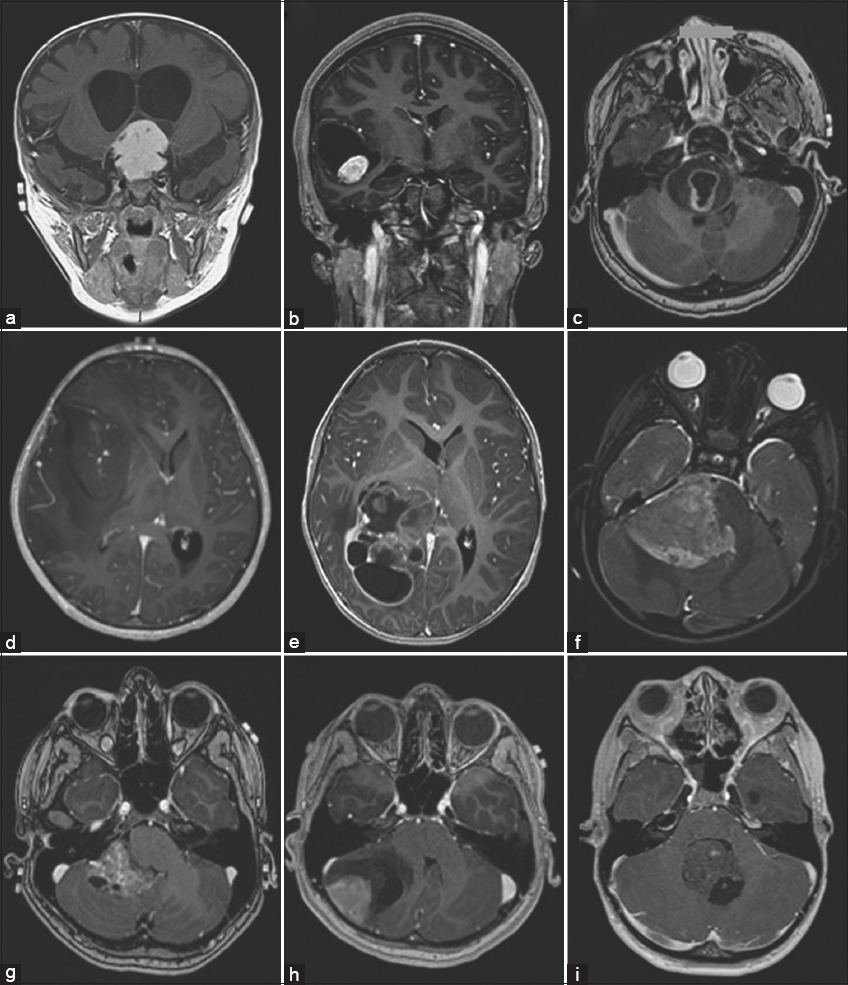
- (a-i) The figure requires the results of the assessment. In the figure, we show an example panel from part 1 of the assessment. The lower left image is an enhanced image and all other images are degraded. The experts must indicate which (if any) is useful
As seen in Figure 4a from Part 2, the experts’ updated images were displayed next to their corresponding 512 × 512 non-degraded counterparts. The improved version’s spatial flaws were assessed by the experts to see if they were acceptable or if they would alter treatment suggestions (see Supplementary Methods for full instructions). Moreover, Part 2 data were combined using score addition. Part 2 enhanced photographs were graded as useful (meaning they were useful in both Parts 1 and 2) if they received a 3, doubtful if they received a 1 or 2, and misleading if they received a 0. (i.e., useful in Part 1, but shown to have an unacceptable error in Part 2).
- (a-d) The figure shows the results of the assessment. The left column of images is the ground truth and the right column is the enhanced versions. It also shows the predicted usefulness likelihood of the enhanced images based on CNR after enhancement. We compare the usefulness and likelihood of the degraded images
In addition, an analysis of inter-rater reliability was performed using a variation of Cohen’s Kappa, as defined by another scholar,[28] which compensates for the presence of prevalence in the data as well as evaluator bias (Supplementary Methods). The data were separated into three sections for this analysis: (1) classification of Part 1 degraded photos, (2) classification of Part 1 enhanced images, and (3) classification of Part 2 enhanced images. The Byrt-Kappa statistic[29-31] was calculated for all possible evaluator pairings, and inferences about the agreement were formed based on the interpretation of Kappa values as recommended by Byrt and Hallgren.[32,33]
To evaluate the capacity of contrast, noise, and CNR to predict image categorization, univariate and multivariate logistic regression were used. The logistic regression models’ quality of fit was evaluated using a deviance statistic. The model deviance is a Chi-squared statistic that evaluates the difference between the maximum log-likelihood of the chosen model and the null model (i.e., the average probability of classification at a given resolution being useful).
Results
Part 1. Image displaying a list of features that make an image useful.
First, we shall characterize the link between contrast, noise, resolution, and very lastly usefulness. There is a good similarity between examiner 1 and 2 (K = 0.33), a strong agreement between examiner 2 and 3 (K = 0.94), and a fair agreement between examiner 1 and 3 (K = 0.36), as determined by the interrater reliability for the classification of degraded images. There was a significant prevalence of Part 1 improved images being categorized as beneficial by all three judges (see Supplementary results). As such, inter-rater reliability calculations for these data are not informative and all evaluators are in near-perfect agreement. In Figure 3a, we display several deteriorated images, the lower left of which has undergone deep learning enhancement. The contrast and noise of each image are related to the 64 × 64 resolution image categorization decisions in the left panel of Figure 3b. The continuous CNR between the brain and CSF is depicted in Figure 3b by the solid contour lines, which are averaged throughout the whole collection of pictures. Contrast and noise were used as predictors in the multivariate logistic regression model that produced the dotted lines, which demonstrate constant usefulness likelihood. The multivariate logistic regression model offered a significant fit with p-values <0.01 for images with each of the four resolutions taken into consideration (p32 × 32 = 7e-6, p64 × 64 = 4e-27, p128 × 128 = 2e-17, and p512 × 512 = 8e-32).
The lines and the average contrast-noise contours indicate a constant similarity that the image is qualitatively agreed upon as well as useful, as can be seen. With areas under their curves >0.85 (curves for the whole dataset in [Figure 3]), average contrast-to-noise and likelihood are both relatively effective classifiers of image utility, as indicated by Figure 3 receiver operating characteristic curves in the right figure.
Figure 3c demonstrates that individual image contrast-to-noise alone is a substantial predictor of usefulness likelihood, stratified by resolution, as average contrast-to-noise appears to be a successful classifier. Based on its CNR = 13, the gray circle in Figure 1a depicts the possibility that the 256 × 256 brain image from the 3 Tesla system will be usable. In Figure 1b gray diamond (CNR = 4) for the 128 × 128 brain image from the 0.05 Tesla system, the identical result is displayed. Despite having twice the resolution and 3 times the CNR as the image created by the 3T system, both images have a predicted utility likelihood of one. The four inset panels of Figure 3c display the raw categorization data from Part 1 for each resolution. The logistic regression model is represented by solid lines, whereas the 95% confidence intervals around the fit are represented by dashed lines.
Part 2: Reconstruction of errors is acceptable
We then look into how deep learning enhancement affects image classification. There is only a little agreement between evaluators 1 and 2 (K = 0.15), and only moderate agreement between evaluators 1 and 3 (K = 0.48), according to the inter-rater reliability for the classification of improved images in Part 2. It is a side-by-side comparison of the facts (left column) and related improved photographs, as seen in Figure 4a (right column). Take note of the minor inaccuracies in the top-right image’s placement of the brain and the CSF as well as the more obvious flaws in the lower-right image. Despite these spatial flaws, the enhancement network greatly raises CNR, as seen in the plot in Figure. The average CNR of test images at each network point is shown before and after augmentation in Figure 4b using the logistic models developed in Part 1 of this article. Based on higher CNR, these Preda ICT data have a very high possibility of being useful for enhanced photos. Although the classification of enhanced images in Part 1 did closely resemble the expectation of high usefulness, the likelihood, the table in Figure 4c demonstrates that many improved images have defects that are not clinically acceptable. For these images, we additionally classify them as misleading (i.e. images that were deemed Useful in Part 1 but had unacceptable errors in Part 2).
A new logistic regression model with pre-enhancement noise and image contrast as predictors was created for Part 2 because the logistic models generated in Part 1 do not adequately represent the Part 2 categorization. Only contrast showed significance [Figures 5 and 6] so, to observe the practicality probability of a noisy image (as in Part 1) with the danger of misleading mistakes in a boosted image (as in Part 2), the noise was eliminated from the motor. Based on Part 2 classification, an extra logistic regression model was calculated with CNR as the predictor [Figure 4d]. Based on a univariate logistic regression with the usefulness likelihood of the enhanced images as the predictor, the risk of misleading results is computed to be 1 minus the likelihood that the upgraded images will be beneficial. A 128 × 128 image is more likely to be helpful when it is degraded (left vertical axis) and probably to be less misleading when it is improved as CNR rises (right vertical axis). It should be noted that no CNR value exists, for which there is a low possibility of the poor-quality image being usable and a low danger of producing an inaccurate image by augmentation.
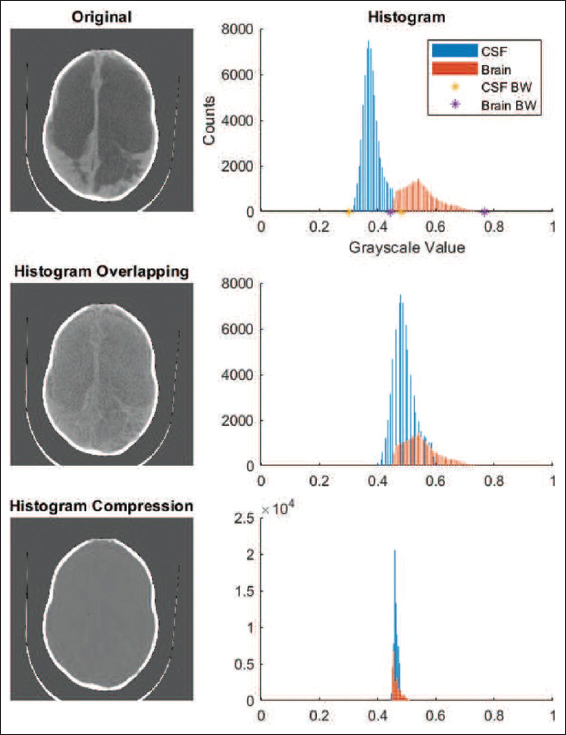
- We can see the role of the histogram and its direct impression on our brain scan images
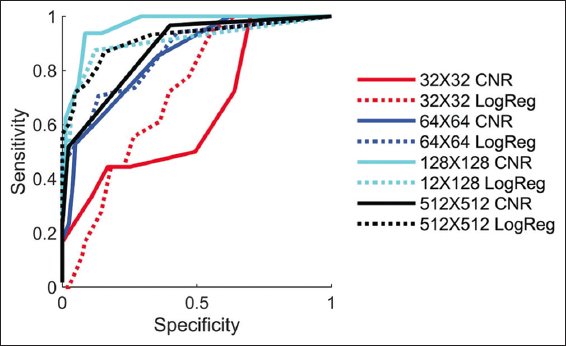
- The figure shows the various resolution images and their impact on CNR and LogReg images. So, we could say that the image’s resolution is directly proportional to image sensitivity
Discussion
Features and benefits of low CNR images
The quality of the minimum acceptable images mandatory for the preparation of therapy for hydrocephalus is suggestively lesser than the quality naturally provided by CT or high-field MRI imaging modalities. Various perspectives might be taken on the results in Figure 3b and c. The SNR of two locations of interest is compared using the CNR method. This suggests that per-voxel signal-to-noise, for which high-field MRI has an inherent advantage over low-field MRI, is the real limiting factor of image quality. However, Figure 3b and c shows that, using low CNR or low-resolution photos may have benefits. Resolution and SNR can be compromised when employing a piece of high-field equipment to swiftly scan for infant hydrocephalus. As an alternative, a low-field MRI system has the potential to provide equivalent diagnostic data in the resource-constrained context of an LMIC at a far lower cost and level of complexity. A lower SNR and greater interpretability are the prices to pay for this cheap cost and complexity. The threshold for the lower bound of signal-to-noise is established by interpretability.
The feasibility probability for the 0.05 T (CNR = 4) and 3T (CNR = 13) MRI images is represented in Figure 1 is displayed in Figure 3c without improvement of deep learning. Despite the obvious differences in visual quality between the two images, it is projected that they will both be equally helpful for the planning of hydrocephalus therapy.
The purchase cost of the 0.05 T system used to create the image is in Figure 1b is less than USD 20,000 USD, to put this in the context of global sustainability. A 3T system can give more than 3 times the CNR for at least 2.8 million USD more (without siting, maintenance, and consumables) [Figure 1a]. For the overall price with only one single 3T scanner around 150 lower quality MRI scanners may, however, be put all over the whole region, boosting access to patients with hydrocephalus without sacrificing the value of the diagnostics.
Hydrocephalus is not only a significant worldwide health issue for pediatric care, but it is also a very simple technical problem for low-field MRI equipment. For diagnosis, triage, monitoring, or treatment planning in the great majority of hydrocephalic children, it is not necessary to discriminate contrast within the brain parenchyma.
The strongest signal inside the head for MRI comes from the water-based CSF. Although our findings show that low-quality images are useful for managing hydrocephalus, other diseases will provide more difficult diagnostic and therapeutic choices, which will make these technologies more difficult to use.
Enhanced images are risky but beneficial
Based on Part 1 data, it appears that image enhancement performs remarkably well, as described in the give Figure 4a, where even the relatively poorer network sites are more than 83% expected to be made suitable. Though, evidence from the experimental Part 2 shows that augmentation produces pictures that seem helpful instead lead to treatment conclusions being made based on intolerable inaccuracies in the brain and CSF location. An improvement in CSF diversion with a shunt or endoscopic fenestration may necessitate surgery, according to subtle changes in the shape of the CSF spaces, such as enhanced rounding of the brain ventricles. Clinicians could be misled into choosing the wrong course of treatment if traits such as these are the result of the enhancement network rather than being an accurate reflection of the underlying state of the disease.
The source of danger is the main distinction between employing a degraded image and its enhanced counterpart in a clinical environment. The decision to utilize a degraded image to diagnose or treat a patient depends on the clinician’s assessment of the risk involved. In this study, enhanced images provide useful-appearing images 99% of the time, yet after comparison with ground truth, 78% of these images are revealed to have dubious utility or to be deceptive. The deep learning network’s “black box” introduces the possibility of augmentation. Furthermore, as seen in Figure 4d, there is never a CNR, for which the danger of producing a false image and the probability that the degraded image will be unusable without improvement are low. As an illustration, a damaged image of 128 × 128 pixels with a moderate CNR giving a usefulness likelihood of 75% nevertheless has a 14% risk of being misrepresented through augmentation. The possibility of usefulness can be raised by enhancing severely damaged images, but there is a significant rise in the danger of inaccurate results. No situation that we can securely uncover supports enhancement. Furthermore, keep in mind that the CNR of the 0.05 T system under study had a very high likelihood and did not need to be improved. However, the adoption of such unedited images as those in Figure 1b would mark a cultural change from the accepted norms of diagnostic quality.
With severely degraded information content, machine learning can produce pleasing patterns. Philosophically, using knowledge not present in the specific case being improved is made possible by a learning library of other patient images. Such newly acquired knowledge used in a novel case scenario may be clinically deceptive. There is just one right match in this scenario, because the necessary information is already in the learning stage, unlike when the machine learns faces or objects, or diagnoses from photos. Like many other medical disorders, hydrocephalus tends to give each patient a different anatomical pattern. Automating the selection of a diagnostic is thus very different from recreating an unidentified unique architecture in terms of machine learning.
This fundamental problem suggests that, even though only one learning network design was used in this study, this risk probably exists in other machine learning techniques, and caution should be exercised when using these techniques for anatomic reconstruction. When analyzing low-resolution, low-contrast images, the machine learning community has a challenge: how to improve interpretation while lowering the likelihood of clinical errors.
Some limitations of this study
This research contains some flaws. The evaluation was limited to three experts. To show image quality and improvement, just the core slice of the image stack was used. The aberrations in the low-field image were ignored, and only low-field system-specific image quality concerns, such as noise and contrast, were taken into account. There was only one deep learning network architecture used, and there were not many training samples.[29-30] However, for illnesses specific to LMICs, like post-infectious hydrocephalus in sub-Saharan Africa, the size of the readily available image archives is often not very large. A 3D array of connected slices could be used in a more sophisticated machine-learning technique for improvement and clinical review.
Although the development of clinical low-field MRI as a tool for hydrocephalus treatment planning served as the impetus for this investigation, the work was carried out using CT scans. The preferred high-resolution alternative to low-field MRI in high-resource environments (such as intensive care units) is still CT. The high-resolution modality with the greatest accessibility in LMIC is CT, which is also the only repository for post-infectious hydrocephalus pictures until low-field MRI is widely adopted. Please take note that we only use one example image in Figure 1b to illustrate the possible advantages of low-field MRI. As reliable low-field MR image repositories become accessible in the future, like the newly reported comparison resource in adult stroke, this can be expanded. The quantitative amount of CNR among the brain and CSF should be generalizable to MRI at different solid areas as well as some other CT investigations for the management of baby hydrocephalus. If CNR shows to be a useful classifier for additional conditions that may have stricter picture quality criteria, further analysis will be required.
Conclusion
Instead of its esthetic appeal, a clinical medical image’s genuine worth lies in the information; it provides on how to treat patients and in the outcomes that follow. We have demonstrated that treatment planning for hydrocephalus can benefit from using lower-quality pictures that are not often regarded as acceptable. In addition, the chance of a meaningful image for hydrocephalus treatment planning is predicted by the image resolution and CNR of the brain and CSF. Although deep learning can significantly improve an image’s visual quality despite its severe degradation, there is a significant risk of inaccurate outcomes, therefore algorithmic standards should be devised to prevent structural changes that could be dangerous for clinical interpretation. Currently, the least enhanced low-resolution images that keep the structural details intact and are not distorted by excessive deep learning processing may be the most valuable; in fact, new low-field MRI technologies are capable of producing useful images for hydrocephalus treatment planning without enhancement. Our findings call for a re-evaluation of what constitutes acceptable image quality for clinical usage as well as new guidelines for evaluating the cost-effectiveness of sustainable imaging technologies that can increase access to diagnostic imaging globally.
However, like other new technologies, this technology also has some pros, as well as cons and those points, should be considered according to the seriousness of the patient, need for this technology, and also working background also. Pros of Assessing the Low-Field magnetic resonance imaging (MRI) for the Brain Scan Image of the Infant Hydrocephalus are Low-field MRI is a non-invasive imaging modality that does not require ionizing radiation, making it a safer option for infants with hydrocephalus compared to other imaging techniques such as CT scans; MRI provides high soft-tissue contrast, allowing for the detailed visualization of brain structures, which is particularly beneficial for assessing the brain of infants with hydrocephalus where precise anatomical information is crucial for diagnosis and treatment planning; low-field MRI has the potential for the early diagnosis of hydrocephalus in infants, allowing for prompt medical intervention and management, which can prevent further complications and improve outcomes. On the other hand, some drawbacks are also connected to this technology. Some of them as follows: Low-field MRI typically has lower image quality compared to high-field MRI, which may result in reduced spatial resolution, SNR, and CNR. This may affect the ability to accurately identify and characterize hydrocephalus in infants, especially in cases with subtle findings; low-field MRI may require longer scan times compared to high-field MRI, which can be challenging in infants due to their limited ability to cooperate and remain still during the imaging procedure; In cases of complex hydrocephalus, such as when there are associated brain abnormalities or when evaluating shunt function, low-field MRI may have limitations in providing detailed and accurate information compared to high-field MRI, which may have higher diagnostic accuracy; It’s important to note that the pros and cons of assessing low-field MRI for infant hydrocephalus may vary depending on the specific imaging protocol, equipment, and expertise of the imaging team. It’s essential to carefully consider the benefits and limitations of low-field MRI in the context of each individual case and consult with a qualified medical professional for proper evaluation and management of hydrocephalus in infants.
Ethics Approval and Consent to Participate
This study was conducted in accordance with the ethical principles of the declaration. The Institutional Ethics Committee approval was obtained before the study and registered at Clinical Trial Registry India. Written informed consent was obtained from all the participants.
Availability of Data and Material
The data that support the findings of this study are available from the corresponding author upon reasonable request.
Competing Interests
The authors declare no conflicts of interest.
Funding Statement
No external funding was received for this project. It is an investigator-initiated academic study.
Authors’ Contribution
SS: Performed data collection and manuscript drafting. QMR: Designed the study, conceptualization, methodology, and manuscript drafting. Both authors reviewed and approved the final version of the manuscript.
Acknowledgments
The author would like to thank all the patients who participated in this study.
References
- Image Quality Transfer via Random Forest Regression:Applications in Diffusion MRI. In: In:International Conference on Medical Image Computing and Computer-Assisted Intervention. Berlin: Springer; 2014. p. :225-32.
- [Google Scholar]
- Hall Computed tomography--an increasing source of radiation exposure. N Engl J Med. 2007;357:2277-84.
- [Google Scholar]
- Brain MRI Super-resolution using 3D Deep Densely Connected Neural Networks. In: In: 2018 IEEE 15 th International Symposium on Biomedical Imaging (ISBI 2018). United States: IEEE; 2018. p. :739-42.
- [Google Scholar]
- Learning based segmentation of CT brain images:Application to postoperative hydrocephalic scans. IEEE Trans Biomed Eng. 2017;65:1871-84.
- [Google Scholar]
- Analysis of human brain by magnetic resonance imaging using content-based image retrieval. Int J Health Sci (Qassim). 2020;14:3-9.
- [Google Scholar]
- Brain image super-resolution using spatio-structural priors. IEEE Trans Image Process. 2019;29:1368-83.
- [Google Scholar]
- Understanding the differences in the prevalence of epilepsy in tropical regions. Epilepsia. 2011;52:1376-81.
- [Google Scholar]
- Global hydrocephalus epidemiology and incidence:Systematic review and meta-analysis. J Neurosurg. 2018;130:1065-79.
- [Google Scholar]
- A review on CT image noise and its denoising. Biomed Signal Process Control. 2018;42:73-88.
- [Google Scholar]
- MRI Pyschophysics:An experimental framework relating image quality to diagnostic performance metrics. J Magn Reson Imaging. 2013;37:1402-8.
- [Google Scholar]
- DENSE123'COLOR Enhancement Dehazing Network. In:Proceedings of the IEEE/CVF Conference on Computer Vision and Pattern Recognition Workshops 2019
- [Google Scholar]
- Computing inter-rater reliability for observational data:An overview and tutorial. Tutor Quant Methods Psychol. 2012;8:23-34.
- [Google Scholar]
- Field strength in neuro-MR imaging:A comparison of 0.5 T and 1.5 T. J Comput Assist Tomogr. 1990;14:505-13.
- [Google Scholar]
- Clinical Low Field Strength Magnetic Resonance Imaging:A Practical Guide to Accessible MRI. Vol Vol. 377. Berlin: Springer; 2015. p. :2456-64.
- MR imaging field strength:Prospective evaluation of the diagnostic accuracy of MR for diagnosis of multiple sclerosis at 0.5 and 1.5 T. Radiology. 1995;194:257-62.
- [Google Scholar]
- Survey:Interpolation methods in medical image processing. IEEE Trans Med Imaging. 1999;18:1049-75.
- [Google Scholar]
- Portable, bedside, low-field magnetic resonance imaging for evaluation of intracerebral hemorrhage. Nat Commun. 2021;12:5119.
- [Google Scholar]
- Design of a sustainable pre polarizing magnetic resonance imaging system for infant hydrocephalus. Magn Reson Mater Phys Biol Med. 2018;31:665-76.
- [Google Scholar]
- In vivo, 3D Brain and Extremity MRI at 50 mT using a permanent magnet Halbach array. Magn Reson Med. 2021;85:495-505.
- [Google Scholar]
- The bacterial and viral complexity of postinfectious hydrocephalus in Uganda. Sci Transl Med. 2020;12:eaba0565.
- [Google Scholar]
- Brain MRI Super-resolution using Deep 3D Convolutional Networks. In: In: 2017 IEEE 14 th International Symposium on Biomedical Imaging (ISBI 2017). United States: IEEE; 2017. p. :197-200.
- [Google Scholar]
- Emerging use of ultra-high-field 7T MRI in the study of intracranial vascularity:State of the field and future directions. AJNR Am J Neuroradiol. 2020;41:2-9.
- [Google Scholar]
- Brain growth after surgical treatment of infant post-infectious hydrocephalus in sub-Saharan Africa:Two-year results of a randomized trial. J Neurosurg Pediatr. 2021;27:1-9.
- [Google Scholar]
- Assessment of brain injury using portable, low-field magnetic resonance imaging at the bedside of critically ill patients. JAMA Neurol. 2020;78:41-7.
- [Google Scholar]
- LRTV:MR image super-resolution with low-rank and total variation regularizations IEEE Trans. Med. Imaging. 2015;34:2459-66.
- [Google Scholar]
- Dense Scene Information Estimation Network for Dehazing. In:Proceedings of the IEEE Conference on Computer Vision and Pattern Recognition Workshops 2019
- [Google Scholar]
- Focal hepatic lesions:Comparative MR imaging at 0.5 and 1.5 T. Radiology. 1990;174:153-6.
- [Google Scholar]
- Sparse representation-based MRI super-resolution reconstruction. Measurement. 2014;47:946-53.
- [Google Scholar]
- Educate one to save a few Educate a few to save many. World Neurosurgery. 2013;79:S15-e15-8.
- [Google Scholar]
- Image super-resolution via sparse representation. IEEE Trans Image Process. 2010;19:2861-73.
- [Google Scholar]
- Image reconstruction by domain-transform manifold learning. Nature. 2018;555:487-92.
- [Google Scholar]