
Translate this page into:
Molecular evaluation of early-age plasma adiponectin levels in young obese cases with diabetes mellitus type 1
Address for correspondence: Abousree T. Ellethy, Department of Basic Oral Sciences and Dental Education, Biochemistry Division, College of Dentistry, Qassim University, Buraydah, Saudi Arabia. Phone: +00966546536633. E-mail: aliethay@qu.edu.sa
This is an open-access article distributed under the terms of the Creative Commons Attribution-Noncommercial-Share Alike 3.0 Unported, which permits unrestricted use, distribution, and reproduction in any medium, provided the original work is properly cited.
This article was originally published by Qassim Uninversity and was migrated to Scientific Scholar after the change of Publisher.
Abstract
ABSTRACT
Objectives:
Adiponectin (ADN) is related to insulin resistance and cardiovascular disorders risks. It is negatively controlled in obese cases among diabetes mellitus type 1 (DMT1) patients. The current study evaluates ADN levels in early-aged children 9–12 years old of obese and non-obese cases (DMT1).
Methods:
A cross-sectional study among children aged 9–11 years old, was conducted during the year 2023 within two groups. First was a diabetic children DMT1 group excluding diabetic cases with complications. Second was a healthy children’s control group. Two groups were subdivided into two subgroups, obese and non-obese (n = 6 for each subgroup). ADN concentrations were measured in DMT1 cases related to weight and body mass index among treated and non-treated with insulin-therapy compared to in vitro diabetic rats. Adult albino male rats enrolled in a control group, non-treated diabetic, and insulin-treated diabetic rats. Statistical analysis-based measuring means and standard deviation for each group and comparing them with the student t-test.
Results:
Significantly increased plasma AND levels were detected in DMT1 patients compared to non-diabetic cases (P < 0.001). AND levels were decreased in obese rather than non-obese cases of control or diabetic cases (P < 0.001). Data shows significantly increased plasma AND levels in experimental rats, induced with diabetes (with or without insulin treatment) compared to the control group (P < 0.001).
Conclusion:
Plasma ADN levels were significantly reduced in obese subjects’ diabetics or non-diabetics. It may refer to insulin resistance or mechanisms that prevent further weight gain by decreasing insulin sensitivity and increasing energy expenditure.
Keywords
Adiponectin
Insulin resistance
Obese diabetic children
Diabetes mellitus type 1

Introduction
Adiponectin (ADN) increases insulin sensitivity in both the liver and skeletal muscle and has potent immunosuppressive properties, as it induces the production of the anti-inflammatory mediator’s interleukin (IL)-10 and IL-1RA in primary human monocytes, monocyte-derived macrophages, and dendritic cells. Low ADN levels are associated with an increased risk of atherosclerotic disease such as coronary artery disease. Consequently, decreased ADN levels in obese cases take part in insulin resistance development with increasing atherosclerosis risks. ADN is released by adipocytes and plays a prominent role in the intricate connection between adiposity, insulin resistance, and inflammation. Levels of ADN are inversely correlated with adiposity, meaning an increase in body fat reduces ADN levels and a reduction in fat accumulation increases ADN levels. ADN shows its biological action through several mechanisms such as enhancing insulin sensitivity in the peripheral cells, anti-inflammatory actions by reducing the production of inflammatory molecules, breakdown of fatty acids and inhibiting the production of fatty acids in the liver, and maintaining the health and flexibility of blood vessels. ADN also plays a role in appetite regulation and energy expenditure.[1-4]
Adipose tissues extend in the body as subcutaneous fats, visceral fats, and even bone marrow[5] They participate in the metabolic pathways, fat storage, and maintenance of various physiological roles.[6] They are considered endocrinal organs secreting various active biomolecules of adipocytokines[7] counting ADN, leptin, IL-6, and tumor necrotic factors.[8] Uncontrolled synthesis of adipocytokines takes part in the progress of obesity-related diseases.[9,10]
ADN is a peptide hormone of 244 amino acids of low molecular weight and encoded by a gene localized on chromosome3 q27,[11,12] Adiponectin takes part in liver gluconeogenesis inhibition, induction of fatty acids oxidation within the skeletal muscle, increasing insulin sensitivity, and improvement of homeostasis in energetic pathways. It is considered an anti-inflammatory mediator in different cells through receptors AdipoR1 and R2 signaling mechanisms.[13] It accelerates the breakdown of fatty acids, increases peripheral tissue insulin sensitivity, and prevents the liver from producing glucose.[14]
Overweight promotes insulin inactivity, and subsequently leads to the occurrence of diabetes mellitus with increasing fat storage and impairment of insulin physiological functions related to organs.[15,16] Last decade studies described an association of ADN levels with insulin resistance development.[17] ADN levels are decreased in diabetes mellitus type 2 (DMT2) cases and/or cardiovascular diseases (CAD).[18] Furthermore, ADN plasma levels are decreased in young-age obese than in non-obese subjects.[19]
A significant inverse association between ADN and obesity is distributed among middle-aged subjects.[20] Thus, imperative studies were assessed among young cases, especially those overweight cases exposed to CAD longer than older subjects.[21,22] There is a statistically insignificant relationship between body mass index (BMI) and circulating ADN related to insulin sensitivity suggesting that obesity does not influence serum ADN levels.[23,24]
Therefore, the current study plan was premeditated to evaluate the early-aged plasma ADN levels in young obese cases with diabetes mellitus type 1 (DMT1) among obese and non-obese cases.
Materials and Methods
Study cases
A group of (24) cases (9–12 years of age) are included in the cross-sectional study. The study was conducted during the year 2023. The study plan-based measurement of plasma ADN concentrations in DMT1 cases related to weight and BMI among those treated and non-treated with insulin therapy with comparison to in vitro diabetic rats. It was designed in two groups. The first (DMT1) group was selected based on BMI (kg/m2), duration of the disease, metabolic control, and insulin supplies. The second control group was selected without any metabolic and/or endocrine diseases. The two groups were subdivided into two subgroups, obese and non-obese (n = 6 for each subgroup).
The study was based on diabetic cases receiving human insulin injection treatment twice daily. All subjects were clinically examined regarding medical history, and general and local examinations excluding cases with diabetic complications from the study. Height and weight were measured for calculating biomass index based on weight (kg) divided by height (m2) as an indirect adiposity measurement.[25] Written consent forms were obtained from all participants.
Venous blood samples were collected in evacuated tubes containing an anticoagulant, heparin salt, (Becton, Dickinson, NJ, USA), from the 4 groups under aseptic conditions. Sera were isolated by centrifugation at 800 × g for 10 min using a cooling centrifuge at 4°C to evaluate the levels of glucose, insulin, and ADN.
Experimental animal groups and study design
The adult male albino rats’ experimental animals weighed (200–250 g) were used in this work. Rats were bred in the animal house fed mixed commercial rat laboratory chows for 2 weeks at room temperature with free access to water. Ethical consent was achieved by the Committee of Research Ethics, college of Dentistry, Qassim University. They were separated into three groups each of six rats. Group 1; healthy control rats received intraperitoneal injection of normal saline (n = 6). Group 2; treated or non-treated rats induced with diabetes. They are injected intraperitoneally with freshly prepared streptozotocin (Sigma-Aldrich, USA). It was dissolved in (0. 01 mol/L) citrate buffer solution with pH4.5 based on a dose of 65 mg/kg B.W[26] We considered the rat diabetic when the blood glucose concentration was >350 mg/dL. Group 3; diabetic rats were treated with insulin injection (Actrapid, Novo Nordisk Denmark) subcutaneously with a dose of 30 IU/kg based on body weight/day for 4 weeks[27] (n = 6). After 4 weeks of insulin administration, all rats were fasted for 12 h and then slaughtered by decapitation after anesthesia with intraperitoneal Ketamine (50 mg/kg BW).[28] Blood samples were withdrawn from a lateral tail vein 3 days later. Plasma was separated to measure glucose concentrations.
Laboratory tests
All blood samples were collected within tubes containing (1 mg EDTA/mL) and then plasma was isolated by centrifugation for measuring different parameters. Glucose measurement is based on the conventional enzymatic method (glucose oxidase procedure). Glycosylated hemoglobin HbA1c was determined by commercially available monoclonal antibody technique (Ames, Bayer, Germany).[29,30] The insulin enzyme-linked immunosorbent assay (ELISA) kit is a solid phase ELISA based on the sandwich principles by adding sera samples based coated plates with a monoclonal antibody directed toward a unique antigenic site on the insulin molecule, then incubated with an anti-insulin antibody conjugated with Biotin. After incubation, the unbound conjugate is washed off. During the second incubation step, the streptavidin peroxidase enzyme complex binds to the biotin-anti-insulin antibody, then adding substrate solution of tetramethylbenzidine, then absorbance (OD) of each well was measured at 450 ± 10 nm with a microtiter plate reader. The insulin resistance parameter measurements are based on the HOMA-IR test calculation. HOMA-IR test equals (Glucose [mg/dL] × Insulin mIU/L/405).[31] Plasma ADN levels were detected by the commercial RIA kit (catalog # (ACRP30) from Linco Research Inc. St. Charles.
Inclusion and exclusion research study criteria
We used human young patients diagnosed as type one diabetes mellitus. Insulin therapy was given to these patients. Measurements of hemoglobin A1c, weight, and glucose serum level were performed. Patients with type 2 diabetes, metabolic syndrome, and maturity-onset diabetes of youth were excluded. Furthermore, subjects more than 17 years of age and gestational diabetes were eliminated. In addition, cases with end-stage liver disease, end-stage renal disease, cancer, new-onset diabetes after organ transplant, or a recent cardiovascular event within 3 months before the study start were not accepted in the study.
Statistical analysis
Statistical analysis was performed with Statistical Package for the Social Sciences Statistics (version 20), New York, NY, USA. The assessment data were calculated as mean + standard deviation. The variations in various parameters among study groups were analyzed based on an unpaired student t-test. The significance value level was considered to be P < 0.001.
Results
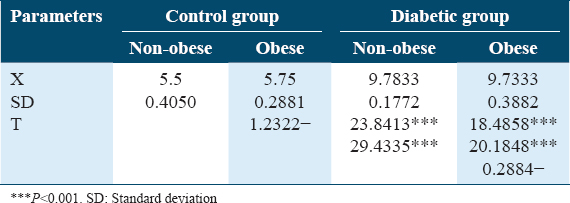
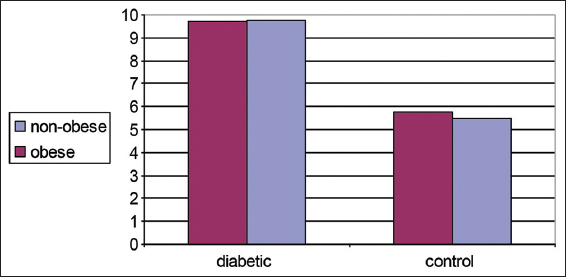
Both Table 1 and Figure 1 illustrate changes in BMI (kg/m2) in control diabetic patients in non-obese and obese subjects. There is no significant increase in BMI in obese compared to non-obese subjects in both groups.
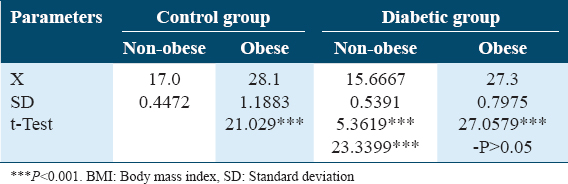
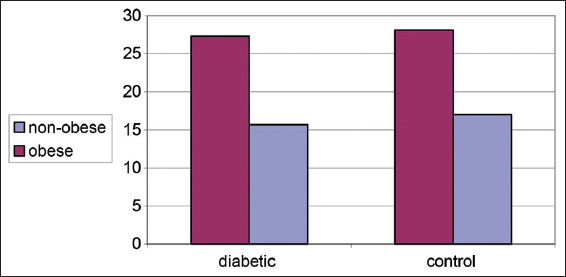
- Changes in body mass index (kg/m2) in control and diabetic patients
Both Table 2 and Figure 2 illustrate changes in ADN (ug/mL) in controls and diabetics among obese and and non-obese cases. Significantly decreased plasma AND levels was detected in obese cases rather than non-obese cases either control or diabetics, (P < 0.001).
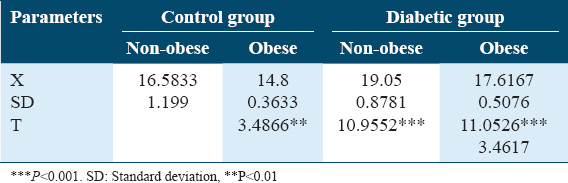
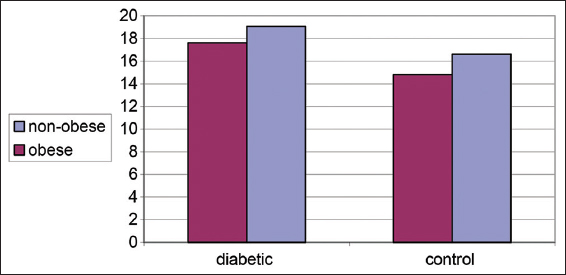
- Changes in plasma adiponectin (ug/mL) in control and diabetic patients
Both Table 3 and Figure 3 show changes in blood glucose levels (mmol/L) in controls and diabetic patients in obese and non-obese cases. A significant increase in blood glucose levels was detected in diabetics than controls. No differences were detected between obese and non-obese cases among different groups.
- Changes in plasma glucose level (mmol/L) in control and diabetic patients
Table 4 and Figure 4 show changes in HbA1c% in non-obese and obese diabetic patients. No significant differences were detected between them which (P > 0.05) denotes a good control of diabetes.
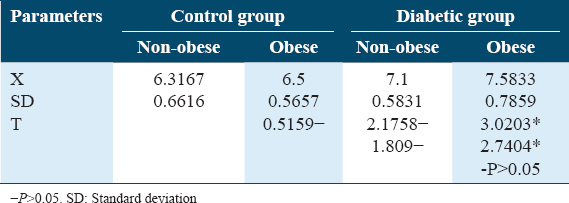
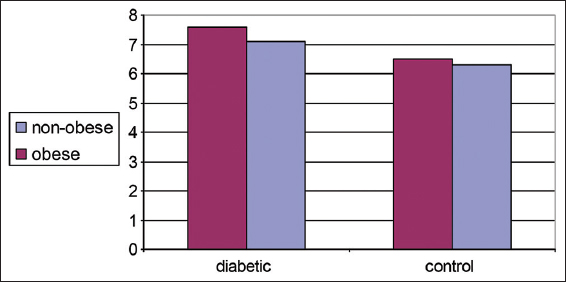
- Glycosylated hemoglobin (HbA1c%) distributions in control and diabetic patients
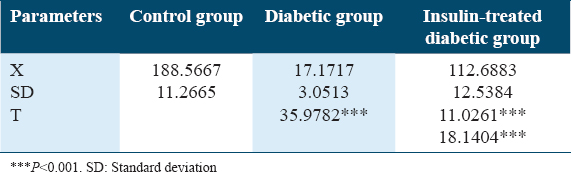
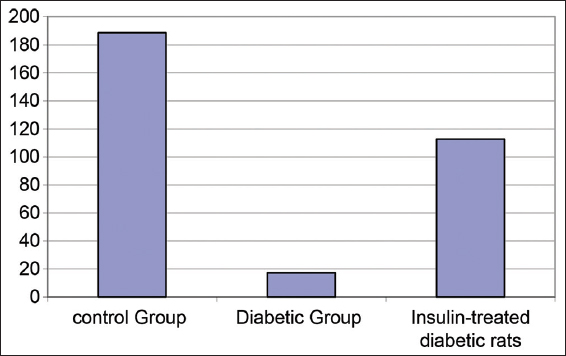
On the other hand, both Table 5 and Figure 5 show variations in body weights (g) in experimental animals of rat’s groups. A significant decrease in body weight was detected for the untreated diabetic rat’s group compared to the non-diabetic rat group with P < 0.001. Furthermore, a non-significantly increased body weight was detected in the insulin-treated rat group when compared with the untreated diabetic one. A non-significantly decreased body weight was detected in the insulin-treated rats group rather than the control one.
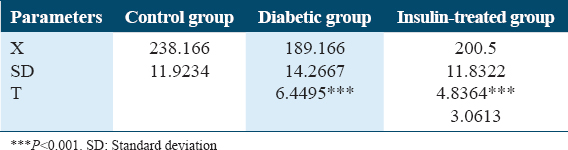
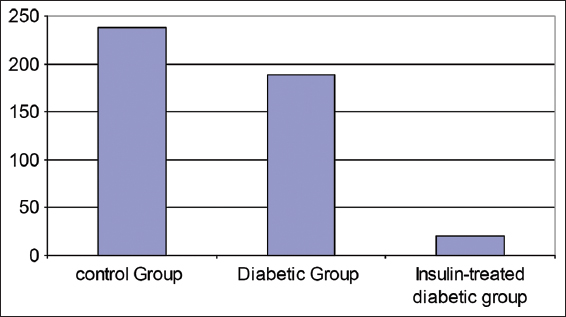
- Change in body weights (g) in experimental animals of rat’s groups
Both Table 6 and Figure 6 show changes in epidydimal fat (g) in experimental animals of rat groups. A significant reduction in epidydimal fat weight (g) was detected among the diabetic rat’s group in comparison to control and insulin-treated diabetic rats (P < 0.01). A significant reduction was detected in epidydimal fat weight in the insulin-treated rat’s group rather than the control rats’ group (P < 0.05).
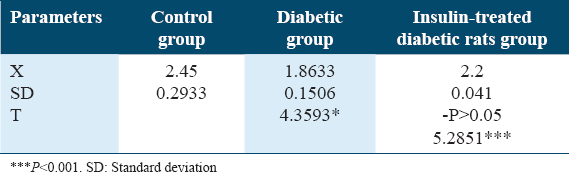
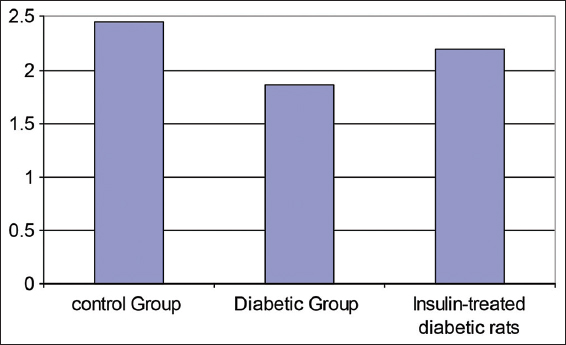
- Epidydimal fat changes (g) in the experimental rat’s group
Table 7 and Figure 7 show changes in insulin levels (pmol/L) in experimental animals A significant reduction of insulin was detected in the diabetic rat’s group in comparing to both the control rat’s group and insulin-treated rat’s group with P < 0.001. In addition, a significant decrease was detected in insulin levels among the insulin-treated diabetic rat’s group in comparing to the control rat’s group with P < 0.001.
- Changes in insulin concentrations (pmol/L) in experimental rat’s groups
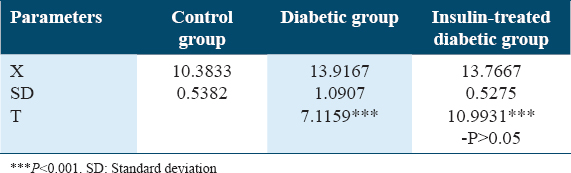
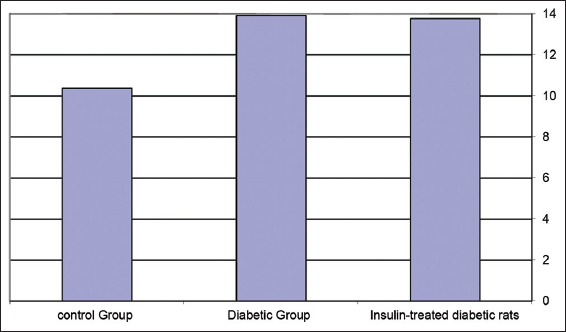
Table 8 and Figure 8 show changes in glucose levels (mmol/L) in experimental rat’s groups. Significant blood glucose level increases were detected in both the diabetic rat’s group and the insulin-treated diabetic rat’s groups with P < 0.001.
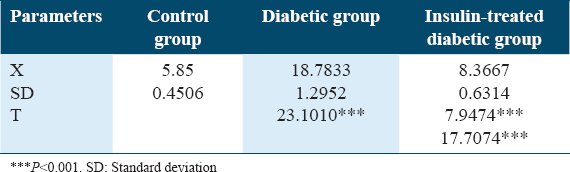
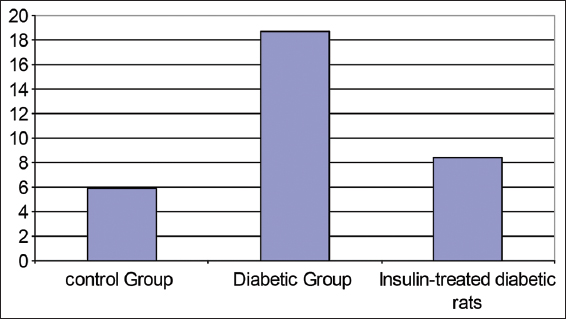
- Changes in plasma glucose level (mmol/L) experimental animals of rat’s groups
Table 9 and Figure 9 show a change in plasma ADN levels (ug/mL) in experimental animals. Significant ADN level increases were detected in the diabetic rat’s group in comparing to both the control rat’s group and the insulin-treated diabetic rat’s group with P < 0.001.
- Changes in adiponectin levels (ug/mL) in experimental rat’s groups
Discussion
The ADN biomolecule is a significant adipose-specific protein and is secreted in adipocytes, it is related to insulin resistance and cardiovascular risks regarding to negative regulations in obese cases. Results show high serum ADN levels in T1DM cases in comparison with healthy control cases (P < 0.01).
The study data are in agreement with Pereira et al.[32] They reported that serum ADN levels were higher in T1DM cases than in the healthy control cases. Similarly, Coimbra et al.[33] informed that chronic renal failure, DMT1, and anorexia nervosa are associated with increased plasma ADN levels.
Moreover, Adiyaman et al.[34] reported that ADN levels are increased in DMT1, but this phenomenon is not attributable to differences in nutritional status or body composition. Furthermore, Timar et al.[35] reported that increased plasma ADN concentrations were found in insulin-resistant cases in contrast to the reduced levels in insulin resistant of DMT2 cases. However, Kaza et al.[36] reported that DMT1 cases were not significantly different from the control healthy cases. However, ADN levels of DMT1 diabetic group cases were higher than those with DMT2.
Plasma glucose levels and/or insulin concentration are possible regulators of circulating ADN levels. Although hyperglycemic levels are common features of both DMT1 and DMT2, they are not critical parameters for circulating ADN concentrations in vivo. Therefore, insulin deficiencies may lead to the elevation of serum ADN levels within DMT1 cases.[37,38] However, insulin therapy does not affect serum ADN levels in DMT1 cases.[35] It is confirmed by Ćwiek et al.[39] study, in which circulating ADN levels did not vary before or after the onset of overt there is a missed phrase in non-obese diabetic (NOD) mice, even insulin levels were decreased dramatically after the onset of diabetes.
The present research data led to a significant increase in serum ADN levels in experimentally induced diabetes in rats in comparison with control rat’s groups (P < 0.001). However, no significant changes were detected in ADN levels among those diabetic (non-treated) and/or insulin-treated diabetic rats (P > 0.05).
Besides blood glucose and insulin levels, many parameters play significant roles in the regulation of ADN levels among DMT1. Research studies reported that many adipocyte proteins accelerate the developing of autoimmune diabetes among NOD mice.[40] In addition, they are expected to control T-cell immune response[41] Last decade’s in vitro research studies indicated that ADN regulates endothelial adhesion molecule expression. It modulates endothelial inflammation whose dysregulation has a central role in insulin resistance and CAD.[42,43]
The current results of increased plasma ADN levels in DMT1, suggest that ADN may induce immune responses like leptin effects in autoimmune diabetes or may be due to increased insulin insensitivity. In addition, it represented a significant reduction of plasma ADN levels in obese cases, diabetics, or non-diabetics (P < 0.01). These results corresponded with Diamond et al.,[44] who reported a significant decrease of plasma ADN levels in the obese cases group rather than those in the non-obese cases. Furthermore, levels of plasma ADN have a significant relationship with the percentage of body fats relative to body weight. Other previous studies about ADN inspected middle-aged subjects with hyperinsulinemia among those obese subjects and represented low plasma ADN levels.[14,15]
In 2020 Vatier et al. study informed lower plasma ADN levels in young obese cases in comparison to non-obese cases, even though adipocytes are responsible for AND recreations.[10] However, the yield of ADN is increased in obesity and insulin resistance. These conclusions ensured an ineffective regulation of ADN in these environments without enough production of ADN to raise the circulating hormone levels as reported by Hoffsted et al.[45]
The ADN levels have a negative association with diabetes and are affected by proper healthy nutrition as mentioned by Khoramipour et al.[46] The plasma ADN levels are increased in middle-aged cases and accompanied by a reduction of body weight based on gastric surgery or dietary therapy.[47] Currently, most researchers hope studying the mechanism of reduction of plasma ADN levels in obese cases, especially those related to therapeutic research studies for metabolic disorders based on AND levels.[48,49]
Controversy still exists regarding the relationship between ADN and diabetes. Recent studies examined the association of AND concentrations, pancreatic beta cells, and their feedback on metabolic diseases regarding weight units’ measurements of adipose tissues where AND levels were decreased in obese cases. This is because the present findings suggested ineffective regulations for ADN levels.[50] Li et al. 2023[58] demonstrated that low circulatory AND is a destructive factor key for pancreatic β-cells. Therefore, they suggested an AND as a strong therapeutic agent for the prevention of β-cells dysfunctions.[51]
Exercise activities affect adipose tissues and secretions of ADN, and other adipokines based on different factors such as age, body composition, gender, physical activity levels, and exercise intensity.[52] However, there are no significant changes in plasma ADN levels during exercises that do not affect body mass.[44] Despite that, the body mass composition is an important factor for adjusting plasma ADN levels.[53]
There is a clear relationship between AND levels and the fat mass body. The ADN levels are significantly decreased within obese cases compared to slim controlled cases. Hence, Thanakun et al.[54] presented that mean plasma ADN levels were low in obese cases with BMI ≥23.0 kg/m2 in comparison with normal BMI. Furthermore, a longitudinal study reported that plasma ADN levels were decreased parallel to increasing adiposity among children group 5–10 years of age.[55,56]
Indeed, El Amrousy et al. 2202 discovered significantly decreased ADN levels in obese hypothyroid children rather than the slim hypothyroid children and controls. In addition, ADN levels revealed an inverse correlation with weight, waist circumference, and triglycerides among children and adolescents[62] and increased after getting weight loss. The AND levels are related to increasing central and visceral obesity. Therefore, it is considered anti-inflammation, anti-atherogenesis, and potent insulin-sensitizing feedback.[57,58]
A systemic review made by meta-analysis study reported elevated levels of ADN and a lower risk of type 2 diabetes mellitus (T2DM),[59] while another recent meta-analysis conclusively showed that hypoadiponectinemia was associated with the development of T2DM.[60] In addition, another recent study reported that ADN receptors might be a component of insulin granules and therapies need to activate ADN receptors to reduce the risk of T2DM and its complications.[61] However, the results on the association between ADN and the incidence of T2DM remain unclear and conflicting. This needs further studies.
Conclusion
Current research displays increasing plasma AND levels in DMT1 cases suggesting that ADN, may influence immune responses like leptin as in autoimmune diabetes research studies, or may be due to increased insulin sensitivity. In addition, the current study investigates whether plasma AND levels were significantly reduced among obese subjects’ diabetics or non-diabetics. This may be due to insulin resistance and/or mechanisms preventing extra weight gain based on decreasing insulin sensitivity and increasing energy consumption.
The ADN concentrations may represent a new strategic treatment plan for the insulin-resistance or an antidiabetic drug. Furthermore, it may allow therapeutic suggestions as an anti-obesity drug and prevention of atherosclerosis. Furthermore, investigations are required for getting more information about ADN effect on cell metabolomics pathways.
Ethics Approval and Consent to Participate
The data were collected anonymously, hence, the consent was not required.
Consent for Publication
The authors have consented to publish this article.
Availability of Data and Material
All related data is made available along with the article.
Competing Interests
The author declares no competing interests.
Funding Statements
The authors have no any relevant financial support.
Authors’ Contributions
The work has been done collaboratively by the two authors.
Acknowledgments
The authors are indebted to Professor Gamal MA Hassan, Professor of Anatomy (email), PhD in Anatomy and MSc Pediatric College of Medicine, Suez Canal University, Egypt, for his valuable guidance and great help in revising the manuscript.
References
- Levels of adiponectin and leptin at onset of type 1 diabetes have changed over time in children and adolescents. Acta Diabetol. 2015;52:167-74.
- [Google Scholar]
- Adiponectin:A promising target for the treatment of diabetes and its complications. Life (Basel). 2023;13:2213.
- [Google Scholar]
- Investigate the relation between adiponectin gene variants and cardiovascular comorbidities and diabetes. Int J Health Sci (Qassim). 2016;10:183-9.
- [Google Scholar]
- Is diabetes becoming the biggest epidemic of the twenty-first century? Int J Health Sci (Qassim). 2007;1:5-8.
- [Google Scholar]
- Design and validation of a novel estimator of visceral adipose tissue area and comparison to existing adiposity surrogates. J Diabetes Complications. 2018;32:1062-7.
- [Google Scholar]
- Adipose tissue distribution, inflammation and its metabolic consequences, including diabetes and cardiovascular disease. Front Cardiovasc Med. 2020;7:22.
- [Google Scholar]
- Adipocytokines:Modern definition, classification and physiological role. Probl Endokrinol (Mosk). 2021;68:73-80.
- [Google Scholar]
- Leptin in leanness and obesity:JACC state-of-the-art review. J Am Coll Cardiol. 2021;77:745-60.
- [Google Scholar]
- Leptin, adiponectin, lipodystrophic and severe insulin resistance syndromes. Ann Biol Clin (Paris). 2020;78:261-4.
- [Google Scholar]
- A novel serum protein similar to C1q, produced exclusively in adipocytes. J Biol Chem. 1995;270:26746-9.
- [Google Scholar]
- Genome wide search for type 2 diabetes-susceptibility genes in French whites:Evidence for a novel susceptibility locus for early-onset diabetes on chromosome 3q27-qter and independent replication of a type 2-diabetes locus on chromosome 1q21-q24. Am J Hum Genet. 2000;67:1470-80.
- [Google Scholar]
- The Dual role of adiponectin and leptin in Type2 diabete. J Popul Ther Clin Pharmacol. 2023;30:e200-14.
- [Google Scholar]
- Adiponectin gene polymorphisms as a predictor for development of type 2 diabetes mellitus in Iraqi population. Gene. 2018;662:118-22.
- [Google Scholar]
- Burden of diabetes mellitus in Saudi Arabia. Int J Health Sci (Qassim). 2015;9:5-6.
- [Google Scholar]
- The adiponectin to leptin ratio, a still unrecognized biomarker of insulin resistance and cardiometabolic risk. Ann Biol Clin (Paris). 2020;78:265-8.
- [Google Scholar]
- Ischemic heart-derived small extracellular vesicles impair adipocyte function. Circ Res. 2022;130:48-66.
- [Google Scholar]
- Insulin resistance:Review of the underlying molecular mechanisms. J Cell Physiol. 2019;234:8152-61.
- [Google Scholar]
- Adiponectin, a therapeutic target for obesity, diabetes, and endothelial dysfunction. Int J Mol Sci. 2017;18:1321.
- [Google Scholar]
- Adiponectin as an adipose tissue hormone and its role in the metabolic syndrome and cardiovascular disease. Endokrynol Diabetol Chor Przemiany Materii Wieku Rozw. 2005;11:187-90.
- [Google Scholar]
- Relationships between body weight status and serum levels of adipokine, myokine and bone metabolism parameters in healthy normal weight and thin children. J Clin Med. 2022;11:4013.
- [Google Scholar]
- Effect of weight loss on high-molecular weight adiponectin in obese children. Obesity (Silver Spring). 2010;18:2288-94.
- [Google Scholar]
- Association between insulin resistance and cardinal rheological parameters in young healthy Japanese individuals during 75g oral glucose tolerance test. Endocr Metab Immune Disord Drug Targets. 2022;22:125-32.
- [Google Scholar]
- Self-monitoring of blood glucose levels in diabetes. Principles and practice. Arch Intern Med. 1984;144:2029-34.
- [Google Scholar]
- Insulin therapy normalizes GLUT.1 m RNA but not immuno-reactive transporter protein in STZ-diabetic rats. Metabolism. 1993;42:939-44.
- [Google Scholar]
- Homeostasis model assessment:Insulin resistance and beta-cell function from fasting plasma glucose and insulin concentrations in man. Diabetologia. 1985;28:412-9.
- [Google Scholar]
- Diabetes Care. 2012;35(Suppl 1):S64.
- A new findex of insulin sensitivity obtained from the oral glucose tolerance test applicable to advanced type 2 diabetes. Diabetes Care. 2002;25:1891-2.
- [Google Scholar]
- Adiponectin dysregulation and insulin resistance in type 1 diabetes. J Clin Endocrinol Metab. 2012;97:E642-7.
- [Google Scholar]
- The protective role of adiponectin for lipoproteins in end-stage renal disease patients:Relationship with diabetes and body mass index. Oxid Med Cell Longev. 2019;2019:3021785.
- [Google Scholar]
- The role of adiponectin in maintaining metabolic homeostasis. Curr Diabetes Rev. 2020;16:95-103.
- [Google Scholar]
- Metabolic syndrome, adiponectin and proinflammatory status in patients with type 1 diabetes mellitus. J Int Med Res. 2014;42:1131-8.
- [Google Scholar]
- The effect of metabolic profile on leptin, adiponectin, and hs-CRP in children and adolescents with type 1 diabetes. Children (Basel). 2022;9:1162.
- [Google Scholar]
- Hormonal regulation of adiponectin gene expression in 3T3-L1 adipocytes. Biochem Biophys Res Commun. 2002;290:1084-9.
- [Google Scholar]
- Association between body fat and bone mineral density in Korean adults:A cohort study. Sci Rep. 2023;13:17462.
- [Google Scholar]
- The effects of breastfeeding and gestational diabetes mellitus on body mass composition and the levels of selected hormones after childbirth. Nutrients. 2023;15:4828.
- [Google Scholar]
- Leptin accelelevels autoimmune diabetes in female NOD mice. Diabetes. 2002;51:1356-61.
- [Google Scholar]
- Leptin modulates the T-cell immune response and reverses starvation-induced immunosuppression. Nature. 1998;394:897-901.
- [Google Scholar]
- Novel modulator for endothelial adhesion molecules:Adipocyte-derived plasma protein adiponectin. Circulation. 1999;100:2473-6.
- [Google Scholar]
- Infliximab therapy restores adiponectin expression in perivascular adipose tissue and improves endothelial nitric oxide-mediated vasodilation in mice with type 1 diabetes. Vascul Pharmacol. 2016;87:83-91.
- [Google Scholar]
- Correlates of adiponectin and the leptin/adiponectin ratio in obese and non-obese children. J Pediatr Endocrinol Metab. 2004;17:1069-75.
- [Google Scholar]
- Adipose tissue adiponectin production and adiponectin serum concentration in human and insulin resistance. J Clin Endocrinol Metab. 2004;89:1391-8.
- [Google Scholar]
- Adiponectin:Structure, physiological functions, role in diseases, and effects of nutrition. Nutrients. 2021;13:1180.
- [Google Scholar]
- Adiponectin:Friend or foe in obesity and inflammation. Med Rev (2021). 2022;2:349-62.
- [Google Scholar]
- Adiponectin reverses b-cell damage and impaired insulin secretion induced by obesity. Aging Cell. 2023;22:e13827.
- [Google Scholar]
- Expression of six transmembrane protein of prostate 2 in human adipose tissue associates with adiposity and insulin resistance. J Clin Endocrinol Metab. 2008;93:2249-54.
- [Google Scholar]
- Adiponectin, resistin, and visfatin in childhood obesity and exercise. Pediatr Exerc Sci. 2015;27:454-62.
- [Google Scholar]
- Exercise improves adiposopathy, insulin sensitivity and metabolic syndrome severity independent of intensity. Exp Physiol. 2020;105:632-40.
- [Google Scholar]
- Increased oral inflammation, leukocytes, and leptin, and lower adiponectin in overweight or obesity. Oral Dis. 2017;23:956-65.
- [Google Scholar]
- Plasma adiponectin concentrations in children:Relationships with obesity and insulinemia. J Clin Endocrinol Metab. 2002;7:4652-6.
- [Google Scholar]
- Adiponectin, HOMA-adiponectin, HOMA-IR in children and adolescents:Ouro preto study. Indian J Pediatr. 2021;88:336-44.
- [Google Scholar]
- Adiponectin as a biomarker of the metabolic syndrome in children and adolescents. Eur J Med Res. 2010;15(Suppl 2):147-51.
- [Google Scholar]
- Effects of probiotic administration on overweight or obese children:A meta-analysis and systematic review. J Transl Med. 2023;21:525.
- [Google Scholar]
- Adiponectin levels and risk of type 2 diabetes:A systematic review and meta-analysis. JAMA. 2009;302:179-88.
- [Google Scholar]
- Adiponectin, TNF-a and inflammatory cytokines and risk of type 2 diabetes:A systematic review and meta-analysis. Cytokine. 2016;86:100-9.
- [Google Scholar]
- Adiponectin:A manifold therapeutic target for metabolic syndrome, diabetes, and coronary disease? Cardiovasc Diabetol. 2014;13:103.
- [Google Scholar]
- Insulin resistance, leptin and adiponectin in lean and hypothyroid children and adolescents with obesity. BMC Pediatr. 2022;22:245.
- [Google Scholar]