
Synergetic effect of doxorubicin and avenanthramide C on VDAC2/MTCH1 mitochondrial axis in breast cancer cells
Address for correspondence: Ehab Mostafa Mohamed Ali (Ehab M. M. Ali), Department of Biochemistry, Faculty of Science, King Abdulaziz University, Jeddah, Saudi Arabia. Department of Chemistry, Division of Biochemistry, Faculty of Science, Tanta University, Tanta, Egypt. Contact Number: +966542723865. Email: emali@kau.edu.sa; ehab_1964@hotmail. com
This is an open-access article distributed under the terms of the Creative Commons Attribution-Noncommercial-Share Alike 3.0 Unported, which permits unrestricted use, distribution, and reproduction in any medium, provided the original work is properly cited.
This article was originally published by Qassim Uninversity and was migrated to Scientific Scholar after the change of Publisher.
Abstract
ABSTRACT
Objectives:
This study aims to evaluate the synergistic effects of doxorubicin (DOX) and the natural phenolic alkaloid avenanthramide C (AVC) on enhancing apoptosis in MCF-7 breast cancer (BC) cells, with a specific focus on the expression of mitochondrial proteins voltage-dependent anion channel 2 (VDAC2) and mitochondrial carrier homolog 1 (MTCH1) involved in apoptosis pathways.
Methods:
MCF-7 cells were treated with various concentrations of DOX and AVC. The 50% inhibitory concentration (IC50) of DOX combined with AVC was evaluated in the MCF-7 cells using an MTT assay, while gene expression levels of Ki-67, MTCH1, and VDAC2 were assessed through real-time polymerase chain reaction. Apoptotic rates were measured using flow cytometry.
Results:
DOX and AVC combination reduced the IC50 value by 2.1-fold compared to DOX alone, indicating enhanced cytotoxicity. Co-treatment significantly downregulated Ki-67 expression and increased apoptosis by 76% in cells treated with 3 μM DOX and 160 μM AVC. Gene expression analysis revealed a 4.8-fold increase in MTCH1 and a 15-fold increase in VDAC2 compared to DOX treatment alone.
Conclusion:
The DOX-AVC combination demonstrated a potent synergistic effect, enhancing apoptosis in BC cells by modulating mitochondrial pathways. This approach may provide a promising strategy for reducing chemotherapy side effects in BC treatment. Further studies in pre-clinical models are warranted to explore its therapeutic potential.
Keywords
Avenanthramide C
breast cancer
doxorubicin
drug synergistic effect
mitochondrial carrier homolog 1
voltage-dependent anion channel 2

Introduction
Globally, breast cancer (BC) is the most common cancer and the second leading cause of cancer-related deaths in women.[1] According to an epidemiological study, in the Kingdom of Saudi Arabia, BC is the most common cancer, with 14.8% of all cancer cases detected in the Kingdom.[2] There are many modifiable and non-modifiable known risk factors, such as gender, aging, prolonged estrogen exposure, family history, and gene mutations, that can increase the possibility of developing BC. Approximately 30% of BC cases are due to modifiable risk factors, which can be preventable.[3] Based on the molecular subtypes of BC, several treatment options are available, such as surgery, radiotherapy, immunotherapy, and chemotherapy that can be chosen to treat BC. However, these treatments unfavorably affect the patient’s health, and some do not respond.[4]
Chemotherapy drugs can be grouped based on their function and chemical structure. They can be classified as alkylating agents, antimetabolites, topoisomerase inhibitors, and mitotic spindle inhibitors. For example, drugs such as irinotecan and topotecan are topoisomerase I inhibitors, while etoposide, teniposide, and anthracyclines (idarubicin, daunorubicin, and doxorubicin) are topoisomerase II inhibitors. These drugs cause breaks in the DNA strands and interfere with the actions of topoisomerases involved in DNA replication and transcription processes, leading to halting the growth and spread of invasive cancer cells.[5] Doxorubicin (DOX), also known as Adriamycin, is a natural chemical extracted from the bacterium Streptomyces peucetius. It is a potent chemotherapy drug approved by the Food and Drug Administration for treating various cancers, such as BC, carcinomas, sarcomas, and hematological malignancies.[6] Its action includes inhibiting DNA replication and RNA transcription, inhibiting topoisomerase II, forming the tertiary structure of DNA, and affecting specific mitochondrial proteins, which induce apoptosis and potentiate free-radical generation and oxidative damage, maintaining high levels of mitochondrial stress. However, the precise mechanisms of the action of DOX are complex and relatively unknown. Patients receiving DOX might experience adverse side effects such as hair loss, vomiting, allergies, and cellular damage to brain cells, renal cells, cardiomyocytes, and hepatocytes.[6,7] Therefore, striving for more efficient counteracting DOX toxicity is crucial while preserving or reinforcing its therapeutic effects.[8]
One promising avenue is the use of natural compounds with anticancer properties. Medicinal plants produce non-essential, small-molecule organic compounds through secondary metabolism to support plant growth and development. These compounds play vital physiological roles in signal transduction, nutrition, stress resistance, and host defense, aiding in plant adaptation to environmental stress, competition, and co-evolution with insects, herbivores, and pathogenic microorganisms. Many plant metabolites, such as phenolic acids, alkylphenols, flavonoids, lignans, aminophenolics, and avenanthramides (AVs), exhibit various pharmacological effects on human health.[9] For example, they can reduce patients’ chemotherapy challenges, enhance the drug’s effectiveness within cancer cells, or activate genes involved in programmed cell death (apoptosis). Furthermore, these compounds can adjunct chemotherapy or alternative cancer treatments. AVs, particularly avenanthramide C (AVC), are compounds found in oats (Avena sativa L.) that may help alleviate the side effects of cancer treatment. AVC possesses antioxidant, anti-inflammatory, and anti-proliferative properties, which makes it a promising candidate for supplementary cancer therapies.[10] Although some research has examined AVC’s ability to modulate apoptosis, its potential to enhance the effects of chemotherapeutic agents, such as DOX has not been thoroughly investigated. Exploring this combination could uncover mechanisms that reduce chemotherapy-induced toxicity while improving treatment outcomes, addressing significant challenges in BC therapy.
Antigen Kiel 67 (Ki-67), a marker of proliferation expressed by the gene MKI67, is a cell-cycle-related protein expressed from the G1 to the M phase and a biomarker of neoplastic cell proliferation. Ki-67 is also involved in ribosome synthesis.[11] Presenilin 1-associated protein is a mitochondrial carrier homolog 1 (MTCH1). It was initially discovered to interact with presenilin 1. There are two types of MTCH, which are MTCH1 and MTCH2. MTCH1 is a mitochondrial transmembrane protein that interacts with Bcl-2, causing apoptosis and Akt/PKB downregulation to reduce angiogenesis, whereas MTCH2 protein reduces energy consumption, co-localizes with Bid protein, which regulates the passage of substances inside mitochondria’s outer membrane, interacts with Bax and suppresses apoptosis.[12] On the other hand, the voltage-dependent anion channel 2 (VDAC2) protein is considered part of the mitochondrial permeability transition pore. It is responsible for permeability in the outer mitochondrial membrane. It is triggered by Bax to release cytochrome c from mitochondria. Cytochrome c interacts with apoptosomes to activate caspase 3, which causes apoptosis.[13] MTCH1 and VDAC2 are mitochondrial outer transmembrane proteins that transport compounds to the inner mitochondrial membrane and trigger apoptosis through distinct pathways.[12]
Therefore, this study investigates the mitochondrial proteins VDAC2 and MTCH1, critical apoptosis regulators. Dysregulation of these proteins is implicated in tumor progression and chemoresistance. The current study introduces a novel 2-by-2 synergistic approach by combining DOX with AVC to simultaneously target two key mitochondrial apoptotic regulators, VDAC2 and MTCH1, in BC cells. This dual-drug, dual-target strategy has not been previously explored, offering a unique mechanism to enhance therapeutic efficacy while mitigating the toxic side effects of chemotherapy. By bridging natural compound adjuvants and conventional chemotherapeutics, this work provides a pioneering framework for integrated cancer treatment strategies targeting mitochondrial dysfunction. The effectiveness of this combined treatment was evaluated in the breast carcinoma cell line (MCF-7) and compared to the colon cancer cell line (HCT-116) and hepatocarcinoma cell line (HepG2). Proliferation of MCF-7 was determined by examining the expression of Ki-67 messenger RNA (mRNA). In addition, the impact of DOX and AVC on mitochondrial membrane dysfunction was assessed by identifying the expressions of VDAC2/MTCH1 by immunohistochemistry (IHC).
Materials and Methods
Chemicals and kits
The MCF-7, HCT-116, and HepG2 cancer cell lines were supplied by the Tissue Culture Unit at the Biochemistry Department, Faculty of Science, King Abdulaziz University, Jeddah, Saudi Arabia. The high glucose growth medium (Dulbecco’s Modified Eagle Medium [DMEM]) and fetal bovine serum (FBS) were purchased from (Hyclone, USA), and the penicillin/streptomycin antibiotics were purchased from (Gibco, UK). The CyQUANT MTT Cell Viability Assay (Cat. No. V13154), High-Capacity complementary DNA (cDNA) Synthesis Kit (Cat. No. 4368814), and RNase inhibitor (Cat. No. N8080119) were purchased from (ThermoFisher Scientific, Waltham, MA, USA). The Annexin V/7ADD Guava® Nexin Reagent was ordered from (Guava Technologies, Inc., Hayward, CA, USA). RNeasy Mini Kit (Cat. No. 74104) was purchased from (Qiagen, Hilden, Germany). The SsoAdvanced™ Universal SYBR® Green Supermix kit that contains DNA polymerase and dNTPs (Cat. No. 172-5270) was purchased from (Bio-Rad Laboratories, Hercules, CA, USA). Finally, the primary antibody against VDAC2 (Cat. No. ab126120) was purchased from (Abcam, Cambridge, UK) and MTCH1 (Cat. No. A16058) from (Antibodies, Cambridge, UK).
The culture condition of cancer cell lines
The three cell lines (MCF7, HCT-116, and HepG2) were grown for 24 h in a flask containing the following complete medium (high glucose growth medium [DMEM], 10% FBS, and 1% penicillin/streptomycin) in a sterile 5% carbon dioxide (CO2) incubator at 37°C and 95% humidity. At 90% confluence, the media was removed, and cells were separated by adding 4 mL of 0.25% trypsin-ethylenediaminetetraacetic acid. Later, all flasks were incubated in a CO2 incubator for 5 min. The trypsin reaction was halted by adding 5 mL of complete media. The pellets were washed twice with sterile phosphate buffer saline (PBS) after centrifugation of the free cells containing the media. Then, 20 μL of this cell-containing media were stained with 0.4% trypan blue, and the number of cells was determined with a hemocytometer and counted in the four large squares. The number of cells/mL was determined by multiplying the counted cells by 1/4*104*2.[14]
Evaluation of DOX and AVC cytotoxicity on cancer cells
The cytotoxic effect of DOX and AVC on MCF-7, HCT-116, and HepG2 cells was assessed using the MTT assay. In a 96-well microplate, 0.1 mL of 5 × 10³ cancer cells (MCF-7, HCT-116, or HepG2) suspended in a complete media were added to each well and incubated for 24 h. Once the cells reached 70% confluence, different concentrations of DOX (0.15, 0.30, 0.60, 1.15, 2.3, and 4.6 μM) and AVC (40, 80, 160, 325, and 650 μM) were introduced to the media. In a separate 96-well plate, each concentration of DOX was combined with 80 or 160 μM of AVC. These combinations were repeated 4 times. Following a 48-h incubation period, the media in each well was replaced with 100 μL of (0.5 mg/mL) MTT reagent-free media and incubated for 4 h. Subsequently, 100 μL of DMSO was added to each well, and the plate was incubated for 15 min at room temperature. The absorbance was then read at 595 nm using a microplate reader (Bio-RAD microplate reader, Japan).[15]
Determining the morphological features of MCF-7 cells treated with DOX and AVC
Two six-well plates were prepared to examine the effect of DOX and AVC combination treatment on the morphological features of MCF-7 cells. In each well, MCF-7 cells at different concentrations were cultured in a medium containing 2 mL of complete DMEM media. One plate had 3 × 10³ cells per well and was incubated for 4 days, while the other plate had 2.5 × 10⁵ cells per well and was incubated for 24 h. After the initial incubation, the media in each well was replaced with fresh media. The fresh media contained 1.5 or 3 μM DOX treatment alone or 160 μM AVC. After 48 h of incubation for both plates, the media was removed from each well and washed twice with PBS. Subsequently, 1 mL of cold methanol (95%) was added to each well and incubated at room temperature for 10 min. Following this, 1 mL of crystal violet solution (0.05%) was added to dye the cells, which were then incubated for another 10 min. Finally, the wells were washed several times with purified water.[16]
Assessment of apoptosis in the treated MCF-7 cells with DOX and AVC
The cells were treated individually with 1.5 and 3 μM of DOX and 160 μM AVC. Two plates containing six wells were prepared, and 2.5 × 10⁵ cells were cultivated in 2 mL of complete DMEM medium in each well. After a 24-h incubation in a CO2 incubator at 37°C and 95% humidity, the medium was replaced with a fresh medium containing 1.5 μM DOX, 3 μM DOX, 1.5 μM DOX with 160 μM AVC, and 3 μM DOX with 160 μM AVC. Following 48 h of incubation, the media from each well was collected. Each well was treated with 0.5 mL of 0.25% trypsin and then incubated for 5 min in the CO2 incubator. Next, 0.5 mL of medium was added to halt the trypsinization reaction, and the cells from each well were collected and centrifuged at 1500 rpm for 5 min. The cells were washed twice with ice-cold PBS and then suspended in 200 mL of PBS with 2% FBS and 50 mL of Guava Nexin reagent. Each well was filled with 120 μL of suspended MCF-7 cells containing annexin V, and each sample was repeated twice. The plate was covered with aluminum foil and incubated for 15 min in the dark. After mixing each well, the samples were analyzed using the flow cytometry Guava instrument and its software to detect phosphatidylinositol binding with Annexin V and 7-AAD fluorescence.[17]
Extraction of RNA from treated MCF-7 cells with DOX and AVC
RNA was extracted from MCF-7 cells following the manufacturer’s protocol of the RNeasy Mini Kit. Two plates with six wells each were prepared as described in MTT and Annexin V/7-AAD methods. MCF-7 cells (5 × 10⁵) were cultured in a 2 mL complete DMEM medium and treated with DOX and AVC. After 48 h of incubation, the media in each well was removed and washed twice with PBS. Then, 600 μL of lysate buffer was added to each well. The lysate was vortexed for 3 min, and 600 μL of 96–100% ethanol was added. The lysate-ethanol mixture was then applied to a spin affinity column, inserted in a collection tube, and centrifuged. The flow from the column was discarded after centrifugation, and the column was washed twice with washing buffers. Finally, 40 μL of RNA elution buffer was applied to the column, and the extracted RNA was measured using a Nanodrop (DeNovix DS-11).[18]
Reverse transcription synthesis of cDNA from extracted RNA
The cDNA was synthesized using the High-Capacity cDNA Synthesis Kit protocol. The concentrations of all RNA samples were adjusted to 1500 ng/mL. For each 10 μL of RNA, 2 μL of 10× reverse transcriptase (RT) buffer, 1 μL of RT enzyme, 2 μL of 10× RT random primers, 3.2 μL of nuclease-free water, and 0.8 μL of 25× dNTP Mix (100 mM) were added into an Eppendorf tube. Then, 1 μL RNase inhibitor was used with the cDNA reagent to prevent the degradation of RNA. The reverse transcription reactions were run on a Bio-Rad thermal cycler (Bio-Rad Laboratories, Hercules, CA, USA) and were programmed following the manufacturer’s protocol as follows: step 1 (25°C for 10 min), step 2 (37°C for 120 min), step 3 (85°C for 5 min), and step 4 (4°C for ∞).
Real-time polymerase chain reaction (RT-PCR) of Ki-67, MTCH1, and VDAC2
The Ki-67, MTCH1, and VDAC2 primers were designed using the website https://genome.ucsc.edu/index.html. Each gene primer was chosen between two exons from the primer3 site and confirmed by the in silico program from the UCSC site. Glyceraldehyde-3-phosphate dehydrogenase (GAPDH) was used as a housekeeping gene [Table 1]. Each sample was run in triplicate in a 96-well plate with 1 mL of 5 pmol/mL primer, 5 mL SsoAdvanced™ Universal SYBR® Green Supermix (containing DNA polymerase and dNTP), and 500 ng/mL of cDNA from MCF-7 treated cells in each well. The plate was sealed and placed in the Bio-Rad thermal cycler. The thermal circulation settings were adjusted for 40 cycles at 95°C for 15 s for DNA denaturation, followed by annealing and extension at 60°C for 30 s. These changes occurred after 30 s of activation at 95°C, enabling polymerase and DNA denaturation. The melting curve was tested upon completion. The cycle threshold was used to measure each desired gene’s fold of mRNA expression (Ct). The delta-delta-Ct (ddCt) was determined by finding the difference between the Ct of untreated MCF-7 and the Ct of GAPDH, while 2- ddCt was used to measure fold shifts.[19]
IHC staining
IHC was performed to investigate the protein expression patterns of VDAC2 and MTCH1 in human triple-negative BC (TNBC) tissue samples. IHC staining was done on 4-μm-thick formalin-fixed, paraffin-embedded sections obtained from the histopathology lab at King Abdulaziz University Hospital, Jeddah, Saudi Arabia. The tissue sections were deparaffinized in xylene and rehydrated through graded ethanol to water. Antigen retrieval was performed at high temperatures using citrate buffer pH 6.0 in a pressure cooker for 15 min. After antigen retrieval, the sections were allowed to cool for 30 min at room temperature. The activity of endogenous peroxidase was blocked by incubating the tissue sections with 3% hydrogen peroxide in methanol for 10 min. Then, to reduce non-specific binding, the sections were treated for 30 min with a protein-blocking solution resulting from normal serum in Tris-buffered saline. The primary antibodies against VDAC2 and MTCH1 were used at optimized dilutions of 1:300 and 1:100, respectively. The sections were incubated overnight at 4°C in a humidified chamber. Afterward, sections were washed in TBS-T and incubated for 30 min at room temperature with a polymer-based horseradish peroxidase-conjugated secondary antibody in the Novolink™ Polymer Detection System from Leica Biosystems. The antigen-antibody complexes were visualized using 3,3′-diaminobenzidine as the chromogen, followed by counterstaining with hematoxylin. Negative controls were performed by omitting the primary antibody, while positive controls consisted of DMSO-exposed BC tissues known to express VDAC2 and MTCH1. Protein expression patterns of the IHC assay were evaluated based on the staining intensity and distribution of VDAC2 and MTCH1. The intensity of staining was scored as 0 (negative), 1 (weak), 2 (moderate), and 3 (strong). Observations accentuated the determination of the predominant expression pattern for each protein among the tumor cells, including cytoplasmic and membranous. Two observers assessed the staining results independently, and any discrepancies that arose were reached by consensus.
To evaluate the protein expression differential patterns for the VDAC2 and MTCH1 proteins, the TNBC tissues were stratified into four groups grounded in the interplay between tumor grade, immune activity (tumor-infiltrating lymphocytes [TILs] percentages), and the potential biological implications of these factors on VDAC2 and MTCH1 protein expression. Nottingham grade 2 tumors were chosen as a separate group due to their relatively moderate level of cellular atypia and proliferation, alongside varying levels of immune activity, which ranged from minimal (10–15%) to high (90%). These characteristics provide a comparative baseline for understanding how TIL activity and tumor grade influence protein expression patterns. Nottingham grade 3 tumors were further stratified into three subgroups based on TIL percentages – high (≥80%), moderate (50–65%), and low (≤30%) – to capture the heterogeneity in immune response within aggressive TNBC cases. This stratification allows for investigating how TIL infiltration correlates with mitochondrial protein expression and tumor progression. The rationale for grouping stems from the hypothesis that grade 3 tumors with high TIL infiltration may display distinct protein expression patterns compared to those with moderate or low TILs, reflecting variations in immune surveillance, stromal remodeling, and mitochondrial activity. Overall, these groups aim to provide a nuanced understanding of how tumor grade and TIL percentages intersect to influence the behavior of VDAC2 and MTCH1 in TNBC tissues.
Statistical analyses
The average viability of treated cells is expressed as mean ± standard deviation (SD). To determine percentage viability, the absorbance of treated cells was multiplied by 100 and divided by that of untreated cells. GraphPad Prism (version 9.0, San Diego, CA, USA) was employed to determine the drug’s 50% inhibitory concentration (IC50) and to analyze the mean and SD values. The proportion of necrotic and apoptotic cells was automatically calculated using Applied Biosystems Flow Cytometry software. The values of P ≤ 0.05 were considered statistically significant.
Results
The cytotoxic effect of DOX and AVC on cancer cells
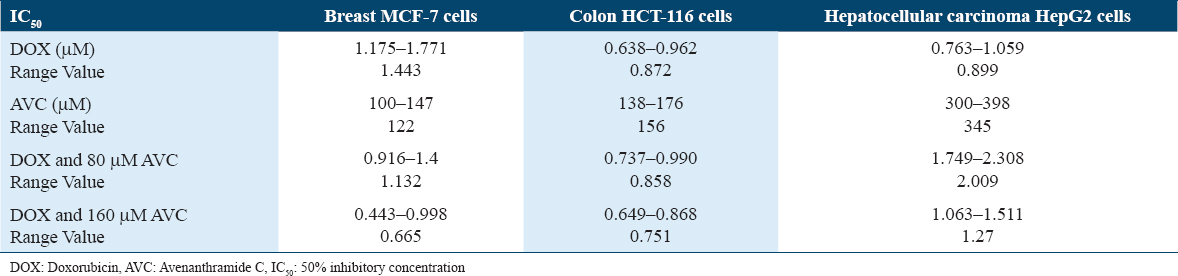
The AVC concentration that inhibited 50% of MCF-7 (IC50) (122 μM) was lower than that of the colon cancer cell line (HCT-116) (156 μM) and hepatocellular carcinoma cell line (HepG2) (345 μM) [Figure 1]. MCF-7 had a higher IC50 (1.443 μM) for DOX than HCT-116 (0.872 μM) or HepG2 (0.899 μM). The efficacy of DOX in combination with 160 μM AVC was reduced to 2.17 times that of MCF-7 treated with DOX. Furthermore, when DOX was combined with 160 μM AVC, the IC50 was found to be lower (1.16-fold) in HCT-116 and (1.41-fold) higher in HepG2 [Table 2]. Therefore, the best lowest IC50 level for DOX in MCF-7 cells was found with 160 μM AVC. Hence, these combined concentrations of DOX and AVC were used for MCF-7 cells in the morphological experiment of cell clones, apoptosis, and gene expression studies for ki-67, MTCH1, and VDAC2.
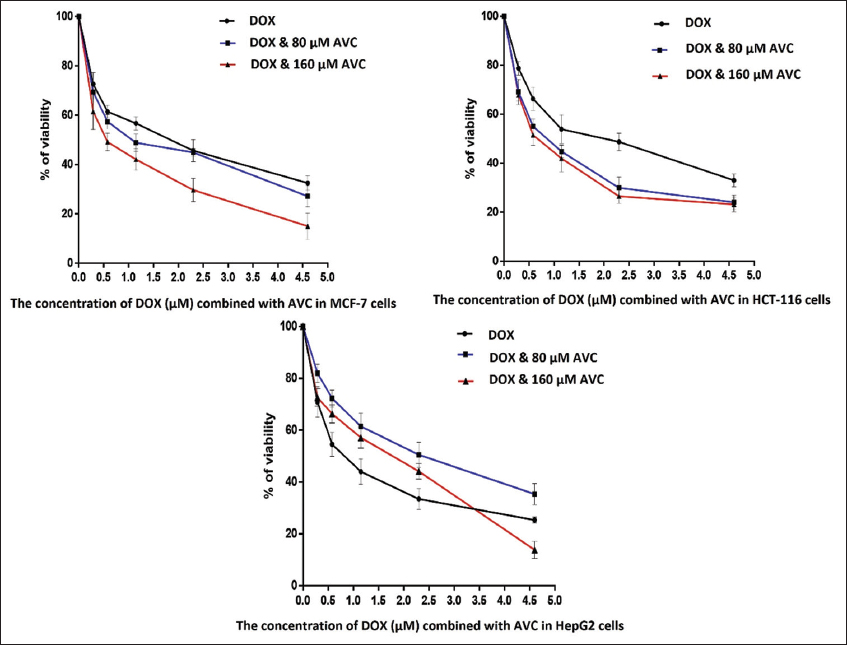
- Percentage of cell viability of breast carcinoma MCF-7 cells, colon cancer HCT-116 cells, and hepatocellular carcinoma HepG2 cells in the presence of the different concentrations of doxorubicin (DOX) combined with 80 and 160 μM of avenanthramide C (AVC)
The effect of DOX and AVC on the morphology of MCF-7 breast carcinoma cells
The morphology of MCF-7 cultivated 3000 cells/well [Figure 2] and 2.5 × 10⁵ cells/well [Figure 3] with the highest concentration of DOX (3 μM DOX with 160 μM AVC) revealed more deformed cells. The number of MCF-7 cells was lower in treated than untreated cells. Many more MCF-7 cells were deregulated in cells treated with 3 μM DOX than in cells treated with 1.5 μM DOX.
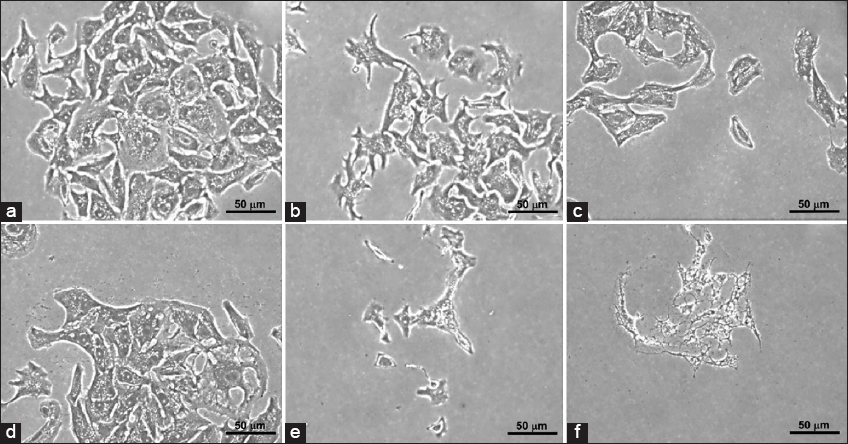
- Clonogenic morphology of breast carcinoma MCF-7 cells using 3000 cells/well. (a) Control; (b) MCF-7 cells treated with 1.15 μM doxorubicin (DOX); (c) MCF-7 cells treated with 1.15 μM DOX and 160 μM avenanthramide C (AVC); (d) MCF-7 cells treated with 2.5 μM DOX; (e) MCF-7 cells treated with 2.5 μM DOX and 160 μM AVC; and (f) MCF-7 cells treated with 160 μM AVC
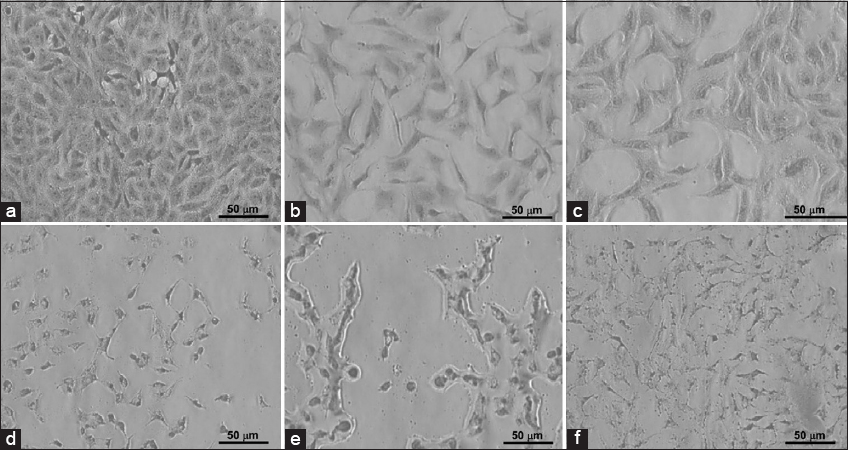
- Clonogenic morphology of breast carcinoma MCF-7 cells cultivated with 2.5 × 10⁵ cells/well in a 6-well plate. (a) Control; (b) MCF-7 treated with 1.15 μM doxorubicin (DOX); (c) MCF-7 cells treated with 1.15 μM DOX and 160 μM avenanthramide C (AVC); (d) MCF-7 cells treated with 2.5 μM DOX; (e) MCF-7 cells treated with 2.5 μM DOX and 160 AVC; and (f) MCF-7 cells treated with 160 μM AVC
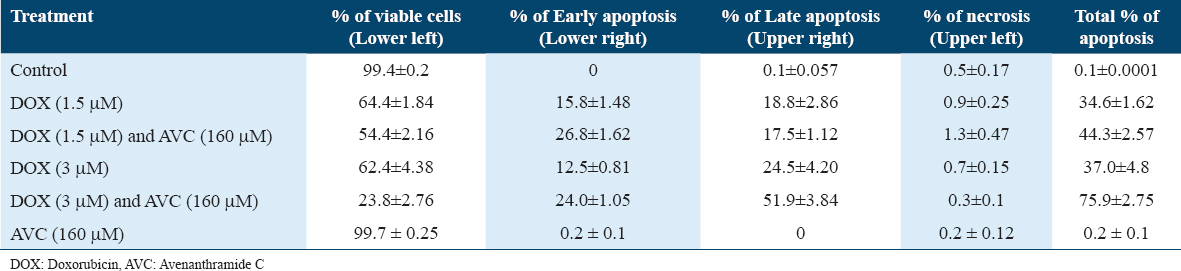
The effect of DOX and AVC on the apoptosis of MCF-7 breast carcinoma cells
Untreated cells of MCF-7 or treated with 160 mM AVC were not observed with apoptosis of the cell. MCF-7 with 3 μM DOX combined with 160 μM AVC was the most significant percentage of apoptosis (75.9%). Two doses of DOX (1.5 and 3 μM) in combination with 160 μM AVC in MCF-7 treated cells were higher in the stage of early apoptosis than once with DOX [Table 3, Figure 4].
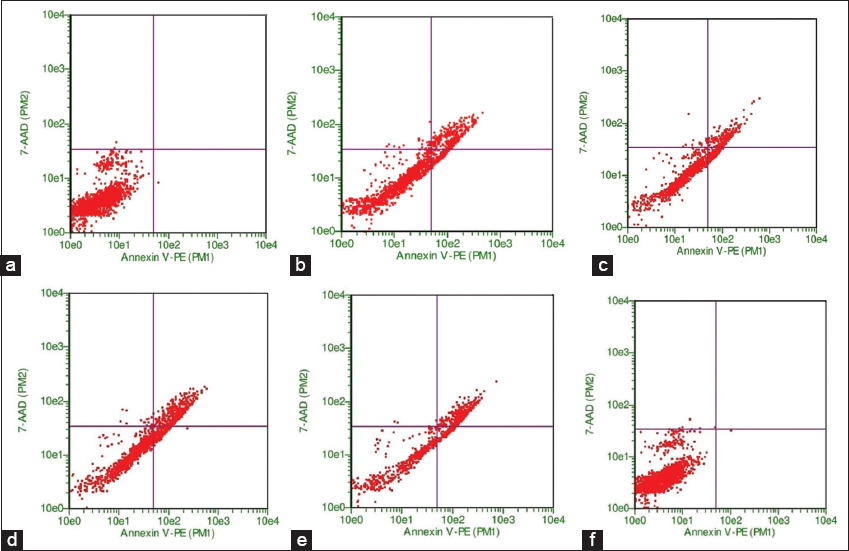
- Flow cytometry analysis of apoptosis in breast carcinoma MCF-7 cells under various treatments. Untreated MCF-7 cells (a) and cells treated with 160 μM of avenanthramide C (AVC) alone (b) did not show significant apoptosis. Cells treated with 3 μM of doxorubicin (DOX) alone (c) and 1.5 μM DOX combined with 160 μM AVC (d) demonstrated a moderate increase in early apoptosis. The most significant apoptotic response was observed in MCF-7 cells treated with a combination of 3 μM DOX and 160 μM AVC (e), with an apoptosis rate of 75.9%. Cells treated with increasing doses of DOX (1.5 μM and 3 μM) in combination with AVC (f) showed higher rates of early apoptosis than those treated with DOX alone
Gene expression analysis using RT-PCR
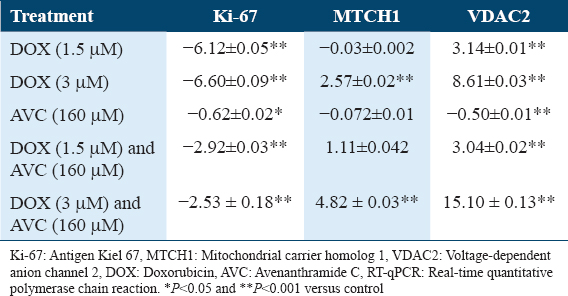
The Ki-67 gene expression was reduced to nearly the same extent in treated MCF-7 cells at 1.5 and 3 μM DOX (6.12 and 6.59-fold). When MCF-7 was given a 160 μM AVC for both DOX concentrations, the downregulation was reduced to 2.9 and 2.5-fold, respectively. In AVC-treated MCF-7, there was almost no difference in Ki-67 gene expression [Table 1]. MCF-7 cells treated with 3 μM DOX (2.57-fold) and 3 μM DOX combined with 160 μM AVC (4.82-fold) had increased MTCH1 gene expression [Table 1]. MCF-7 treated with high-dose (3 μM DOX) had a higher effect on VDAC2 gene expression (8.61-fold) than MCF-7 treated with low-dose (1.5 μM DOX) (3.14-fold). VDAC2 mRNAs were 3.06 and 15.09 folds higher in MCF-7 cells treated with different concentrations of 1.5 and 3 μM DOX combined with 160 μM AVC, respectively. MCF-7 treated with 3 μM DOX combined with 160 μM AVC had a higher gene expression fold of VDAC2 than MCF-7 treated with 3 μM DOX alone [Table 4].
The interpretation for protein expression patterns of VDAC2 and MTCH1 in TNBC tissues stratified by cancer grade and TILs percentage
A thorough protein expression of VDAC2 and MTCH1 in BC paraffin-embedded tissues was performed by IHC staining, as shown in [Figure 5]. Both proteins’ expression differs according to tumor stages, grades, TILs percentage, and treatment regimens.
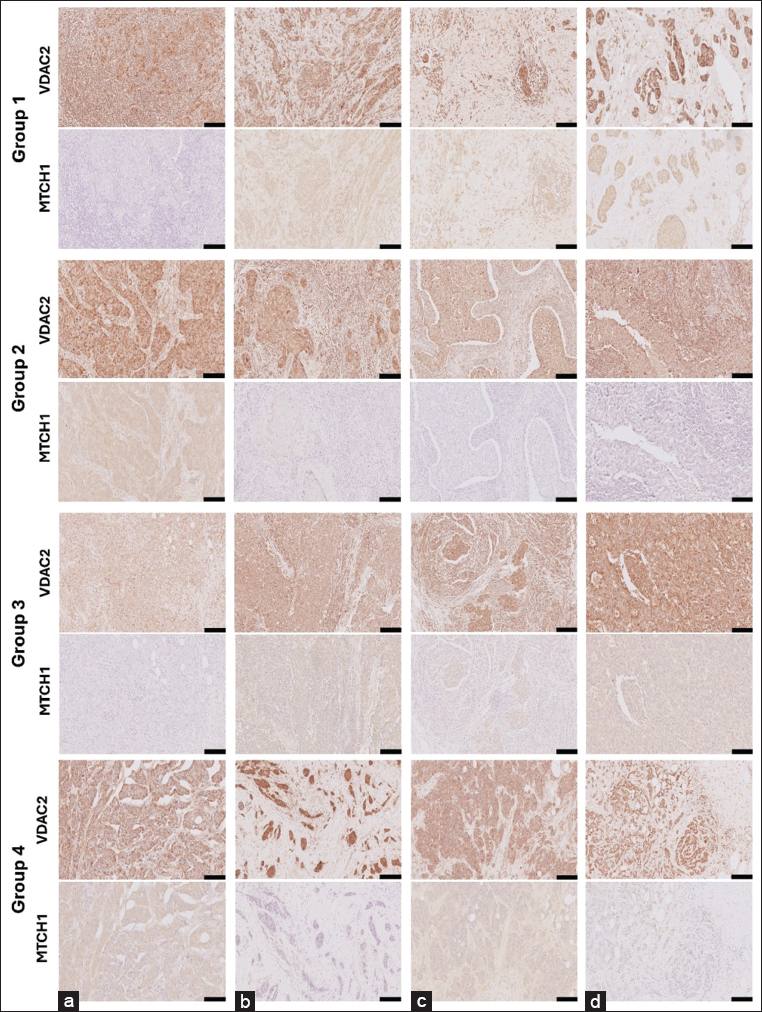
- Group1- VDAC2 (a) MTCH1 (a): A 51-year-old female diagnosed with invasive ductal carcinoma (IDC). The tumor measured 30 mm with a Nottingham grade of 2, marked TILs at 90%, and was classified as Stage IIIA (pT2 pN2 M0). Adjuvant chemotherapy included AC and Taxotere. Group1- VDAC2 (b) MTCH1 (b): A 61-year-old female presenting IDC with associated DCIS. The tumor size was 30 mm, graded 2, with mild TILs under 10%. Staged as IIA (pT2 pN0sn), with no lymph node involvement. Group1- VDAC2 (c) MTCH1 (c): A 43-year-old female with IDC exhibiting a 50 mm tumor and a Nottingham grade of 2. Tumor necrosis present before NAC. TILs were mild at 15%, staged as IIB (pT2 pN0). The patient received neoadjuvant AC chemotherapy. Group1- VDAC2 (d) MTCH1 (d): A 75-year-old female diagnosed with IDC and DCIS. The tumor measured 35 mm, was graded 2, and had mild TILs under 10%. Stage IIIA (pT2 pN2a), with positive lymph nodes in 5 7 samples. Group2- VDAC2 (a) MTCH1 (a): A 67-year-old female with metaplastic carcinoma with squamous differentiation, no DCIS present. Tumor size was 70 mm, with a Nottingham grade of 3, marked TILs at 80%, and classified as Stage IV with metastasis at diagnosis. Group2- VDAC2 (b) MTCH1 (b): A 36-year-old female presenting IDC with extensive DCIS. The tumor measured 10 mm, graded 3, with marked TILs at 90%. Staged as IIIA (pT1b pN2a), with positive lymph nodes in 7 of 18 samples. Group2- VDAC2 (c) MTCH1 (c): A 49-year-old female diagnosed with IDC, no DCIS. The tumor was 35 mm in size, graded 3, with marked TILs at 80%. Stage IIIA (pT2 pN2a), with lymph node involvement (7/15). Group2- VDAC2 (d) MTCH1 (d): A 37-year-old female with IDC, measuring 40 mm, grade 3, marked TILs at 80%. Staged IIA (pT2 pN0(sn)), receiving FAC chemotherapy post-diagnosis. Group3- VDAC2 (a) MTCH1 (a) :A 34-year-old female diagnosed with IDC with atypical medullary features, no DCIS. The tumor measured 20 mm, graded 3, with moderate TILs at 50%. Staged IA (pT1c pN0). Group3- VDAC2 (b) MTCH1 (b) :A 58-year-old female presenting IDC, no DCIS, tumor size 30 mm, graded 3. Moderate TILs at 50%, staged as IIA (pT2). Group3- VDAC2 (c) MTCH1 (c) :A 49-year-old female with IDC and focal micropapillary features, no DCIS. Tumor size was 25 mm, graded 3, with moderate TILs at 65%. Staged as IIB (pT2 pN1a). Group3- VDAC2 (d) MTCH1 (d): A 42-year-old female diagnosed with IDC, no DCIS. The tumor was 25 mm in size, graded 3, with moderate TILs at 55%. Staged as IIA (pT2 pN0). Group4- VDAC2 (a) MTCH1 (a): A 50-year-old female presenting IDC with DCIS. Tumor size was 95 mm, graded 3, with mild TILs at 10%. Staged as IC (pT3 pN3), showing metastatic progression. Group4- VDAC2 (b) MTCH1 (b): A 42-year-old female diagnosed with IDC, DCIS, present. Tumor size 12 mm, grade 3, with mild TILs under 10%. Staged as IIA (ypT1c ypN1a) post-NAC. Group4- VDAC2 (c) MTCH1 (c): A 57-year-old female with IDC and associated DCIS. Tumor size was 88 mm, graded 3, with mild TILs under 10%. Staged as IIIC (pT4b pN3a), with metastatic lung spread noted. The width of the scale bar (▬) at the bottom right corner of each image is equivalent to 100 μM
Group 1: Protein expression in Nottingham grade 2 TNBC tissues: No specific TILs preference
Figure 5 (GROUP1-VDAC2-A) shows notable VDAC2 expression in the tumor cells, with a clear cytoplasmic staining pattern. The staining intensity is moderately strong and evenly distributed across the tumor mass, indicating that VDAC2 plays an active role in mitochondrial function in this triple-negative invasive ductal carcinoma (IDC). As noted in the clinical data, the absence of necrosis aligns with this diffuse staining, suggesting that the tissue architecture is well-preserved and does not show extensive cellular breakdown. The tumor’s microenvironment is heavily infiltrated by lymphocytes, with a TIL score of 90%. This lymphocyte infiltration indicates an active immune response often seen in TNBC. Although TILs are typically linked to a better prognosis in some cases, their presence in this high-grade carcinoma (Nottingham grade 2) could also reflect a robust immune surveillance mechanism that might affect therapeutic responses. The stroma appears desmoplastic, with many activated fibroblasts contributing to the dense interstitial matrix. The endothelial structures of the vasculature are intact, supporting the tumor tissue, but there is no significant evidence of abnormal angiogenesis or endothelial proliferation. This suggests that while immune cells have highly infiltrated the tumor, it remains well-supported by the stromal and vascular components. Figure 5 (GROUP1-MTCH1-A) shows that MTCH1 staining in this consecutive tissue section is significantly reduced compared to VDAC2, with minimal to no visible cytoplasmic expression. This weak or absent staining may indicate downregulation of MTCH1, reflecting a reduced role in mitochondrial carrier functions or apoptosis regulation in this tumor. This reduction in MTCH1 may also be associated with the tumor’s lower nuclear grade (grade 2), indicating less nuclear atypia than more aggressive tumors. Despite the low MTCH1 expression, TILs remain prominent, consistent with the findings in the VDAC2-stained section. This immune solid response across both markers highlights the tumor’s immunogenic nature. The fibroblasts and vascular structures are still present but less noticeable due to the weaker staining. There is no significant increase in stromal activity or angiogenesis, consistent with the tumor’s non-necrotic state. In Figure 5 (GROUP1-VDAC2-B), this section displays strong VDAC2 expression, with intense cytoplasmic staining throughout the tumor cells. This staining pattern is characteristic of triple-negative IDC, highlighting the active role of mitochondria in the tumor’s metabolic functions. The Nottingham nuclear grade of 3 reflects the high degree of nuclear pleomorphism and cellular atypia observed, though some tumor areas show relatively organized glandular structures. There is no evidence of adipose tissue in this section, suggesting that the tumor remains localized within the stroma and has not yet invaded fat-rich regions. The stroma shows a moderate fibroblastic response, contributing to a desmoplastic reaction. Some vascular structures are visible but not particularly prominent, and there are no signs of abnormal angiogenesis. The TIL score is low at 10%, indicating a mild immune response, which may limit the immune system’s ability to counteract tumor progression. Ductal carcinoma in situ (DCIS) lesions are also present, with VDAC2 expression visible in these regions. This suggests that this protein plays a role in both the early and invasive stages of tumor development. In Figure 5 (GROUP1-MTCH1-B), MTCH1 expression in this section is markedly reduced compared to VDAC2, with only weak cytoplasmic staining observed in the tumor cells. This minimal expression indicates downregulation of mitochondrial carrier function, potentially promoting tumor cell survival by reducing apoptosis. The weak MTCH1 staining is consistent with the aggressive behavior seen in TNBC, where mitochondrial dynamics favor tumor survival over apoptotic regulation. The fibroblastic stroma and vascular structures remain similar to those observed in the VDAC2-stained section. The TIL score remains low at 10%, reflecting a modest immune response within the tumor microenvironment. No fatty tissue is visible in this section either, indicating that the tumor is confined to the stromal areas. In Figure 5 (GROUP1-VDAC2-C), VDAC2 expression is strong in this section, with granulating cytoplasmic staining patterns visible at the perinuclear localization in tumor cells. Although the staining is less intense than in other cases of triple-negative IDC, it still highlights the role of mitochondrial function in supporting tumor cell survival. The Nottingham grade of 2, with a tubular grade of 3, nuclear grade of 2, and mitosis grade of 1, reflects a less aggressive tumor, but notable pleomorphism and disorganized architecture are still present. There is no evidence of fatty tissue in this section, and the tumor appears localized within a dense fibrous stroma. The fibroblastic reaction is prominent, contributing to stromal desmoplasia. Vascular structures are sparse and unremarkable, with no signs of significant angiogenic activity. The TIL score is low at 15%, indicating a mild immune response within the tumor microenvironment. DCIS lesions are also present in this section, and VDAC2 staining is visible in these pre-invasive regions, reinforcing VDAC2’s role in both the early and invasive stages of tumor progression. However, in Figure 5 GROUP1-MTCH1-C), MTCH1 expression is significantly reduced, with only faint cytoplasmic staining observed in the tumor cells. This minimal MTCH1 expression is consistent with the characteristics of TNBC, where mitochondrial dynamics shift to support tumor growth and survival by reducing apoptotic signaling. The fibroblastic stroma and vascular structures are similar to those in the VDAC2-stained section, with no notable differences in stromal architecture. The TIL score remains low at 15%, reflecting a weak immune response that may limit the immune system’s ability to control tumor growth. No fatty tissue is present in this section either, and the tumor remains within a dense stromal environment. Figure 5 (GROUP1-VDAC2-D): This section shows focal cytoplasmic positivity for VDAC2 in scattered clusters of tumor cells, though the staining intensity appears weak to moderate. The tissue architecture displays characteristics of IDC, with clusters of malignant epithelial cells infiltrating through a fibrotic stroma. The tumor cells exhibit moderate pleomorphism, leading to a Nottingham score of 2, driven by a lower nuclear grade (nuclear grade 2, tubular grade 3, and mitosis grade 1). There are few TILs, with a 10% score indicating a weak immune response. There is no evidence of necrosis, and some of the stroma contains sparse areas of fibrosis. Adipose tissue is present in small amounts, with a clear separation between the malignant cells and the fat. In Figure 5 (GROUP1-MTCH1-D): MTCH1 staining in this section is weak to moderate and cytoplasmic, with low expression levels in the tumor cells. Scattered foci of IDC cells occupy the stromal architecture. The overall tumor morphology suggests a well-differentiated carcinoma with less aggressive features. The low-grade mitotic rate of 1 and mild TIL infiltration further reinforce the slower-growing nature of this tumor. No evidence of tumor necrosis, vascular invasion, or extensive lymphocytic infiltration is observed, suggesting a more indolent disease course. Adipose tissue is prominent in this section, and the tumor cells are seen infiltrating around the fat cells in a non-aggressive manner.
Group 2: Protein expression in Nottingham grade 3 TNBC tissues with high TILs percentage
Figure 5 (GROUP2-VDAC2-A): The tumor cells exhibit cytoplasmic solid granulating staining for VDAC2, suggesting a high level of mitochondrial activity within these cancerous cells. The cells display the typical morphology of IDC, characterized by large, pleomorphic nuclei and scattered mitotic figures, consistent with a Nottingham grade of 3 (tubular grade 3, nuclear grade 3, and mitosis grade 2). There is a pronounced presence of TILs, with a score of 80%, suggesting a robust immune response. No areas of necrosis are visible. The stromal tissue is densely infiltrated by lymphocytes, reflecting aggressive immune activity around the tumor. Although no fatty tissue is observed in this section, stromal fibrosis is noted around the tumor cells, which is common in high-grade tumors. Figure 5 (GROUP2-MTCH1-A): MTCH1 staining is weak to moderate, with diffuse cytoplasmic expression observed. This low to moderate MTCH1 expression suggests limited regulation of mitochondrial apoptosis within the cancer cells. The tumor shows poorly differentiated cells and scattered lymphocytic infiltrates. Despite the relatively weak MTCH1 staining, the tumor architecture is consistent with a high-grade malignancy, and TILs remain prominent. No necrosis, vascular structures, or adipose tissue are visible in this section, though the stroma has a significant fibroblastic component. Figure 5 (GROUP2-VDAC2-B)]: This section unveils intense immunohistochemical staining for VDAC2 in cancer cells, indicating high protein expression. The VDAC2 staining is mainly in the cytoplasm, with some areas showing more pronounced perinuclear staining, which suggests active mitochondrial function. This is consistent with the high metabolic needs of fast-growing malignant cells, particularly in TNBC. There are no prominent necrotic areas, which aligns with the clinical data where no necrosis was mentioned. The tumor microenvironment shows significant infiltration by TILs, covering about 90%, as noted in the clinical report. These lymphocytes spread throughout the tumor’s stroma, suggesting an active immune response that could significantly affect the tumor’s survival mechanisms. However, despite the significant TIL presence, the tumor remains aggressive, likely due to its high-grade nature (Nottingham grade = 3). The fibroblasts in the stroma appear activated, taking on a spindle shape and densely packed, contributing to the desmoplastic reaction often seen in IDC. The vascular structures are relatively preserved, with many lined by intact endothelial cells, indicating that angiogenesis may support the tumor’s growth. However, no significant endothelial proliferation is observed. In contrast, in Figure 5 (GROUP2-MTCH1-B), the MTCH1 staining is much weaker, with most tumor cells showing little to no expression. This reduction in MTCH1 expression may suggest the downregulation of apoptotic signaling pathways, allowing the tumor to evade programmed cell death, a key feature of aggressive malignancies, such as TNBC. Low MTCH1 expression aligns with a more resilient tumor phenotype, where mitochondrial carrier function is impaired, potentially affecting energy dynamics, and survival mechanisms. TILs remain prominent, confirming both markers’ strong immune cell presence. Interestingly, the weak staining makes the stromal fibroblasts and surrounding vasculature visible but less distinct. There is no noticeable increase in vascularization or fibroblast activity compared to the VDAC2-stained section, suggesting that MTCH1 does not directly influence these stromal components. Figure 5 (GROUP2-VDAC2-C): This section shows strong VDAC2 expression, mostly diffused, with dense cytoplasmic staining visible throughout the invasive tumor regions. The high VDAC2 staining highlights could signify mitochondrial involvement in this triple-negative IDC. The tumor cells display marked pleomorphism, nuclear atypia, and irregular glandular structures, consistent with the high Nottingham grade (3), including a nuclear grade of 3. No necrosis is seen in this section, which aligns with the clinicopathological data. TILs are prominent, contributing to a high overall TIL score of 80%. The stromal environment shows a solid desmoplastic reaction, with fibroblasts contributing to the dense interstitial matrix around the tumor clusters. Vascular structures are present, with intact endothelial linings, but no significant angiogenic response is observed. The elevated VDAC2 expression may indicate an increased reliance on mitochondrial pathways, which is common in highly aggressive TNBC, especially in the absence of hormone receptors or human epidermal growth factor receptor 2 amplification. Unlike VDAC2, in Figure 5 (GROUP2-MTCH1-C), MTCH1 expression is significantly reduced, with weak to absent staining in most tumor cells. The low MTCH1 expression may suggest reduced mitochondrial carrier activity, affecting the regulation of apoptosis. This pattern of low MTCH1 expression aligns with the aggressive nature of the tumor, as observed in high-grade TNBC, where mitochondrial dynamics often shift to favor tumor survival under metabolic stress. TILs remain prominent, consistent with the findings from the VDAC2-stained section, indicating an active immune response. Fibroblasts and vascular structures are still present but less emphasized due to the weak MTCH1 staining. The tumor stroma remains stable and reactive, supporting the ongoing immune-tumor interaction within this microenvironment. Figure 5 (GROUP2-VDAC2-D): The VDAC2 expression in this section is highly upregulated, with dense cytoplasmic staining spread evenly across the IDC regions. This high expression suggests that VDAC2 is crucial in sustaining tumor cells’ metabolic activity and survival, particularly in this TNBC. The tumor cells exhibit characteristic pleomorphism, nuclear atypia, and irregular glandular architecture, typical of a Nottingham grade 3 tumor. Interestingly, no DCIS lesions are found, but the invasive component is extensive. The uniform staining pattern across the tumor mass indicates consistently elevated VDAC2 expression in the invasive cells. The absence of necrosis aligns with the clinical report, and the tumor microenvironment shows a high TIL score of 80%, suggesting a robust immune response. The stroma shows a typical desmoplastic reaction, with fibroblasts contributing to the dense extracellular matrix around the tumor clusters. In Figure 5 (GROUP2-MTCH1-D), MTCH1 staining is weak, with little to no discernible expression in the tumor cells. This minimal MTCH1 expression aligns with a mitochondrial profile favoring survival over apoptosis, as MTCH1 is often involved in mitochondrial functions that regulate cell death pathways. The low expression pattern fits the aggressive nature of TNBC, where resistance to apoptosis is common. Despite the low MTCH1 staining, the tumor stroma and TILs remain prominent, indicating that the immune response persists even with the downregulation of this mitochondrial carrier protein. Fibroblasts and vascular structures are still present but less emphasized due to the weak staining. The stroma continues its reactive desmoplastic state, showing that the tumor microenvironment remains stable despite the low MTCH1 expression.
Group 3: Protein expression in Nottingham grade 3 TNBC tissues with moderate TILs Percentage
Figure 5 (GROUP3-VDAC2-A): This section shows positive VDAC2 expression, with cytoplasmic diffused and granulating staining throughout the tumor cells. The staining pattern is typical of triple-negative IDC, highlighting the high mitochondrial activity required for tumor growth and survival. The high Nottingham grade of 3 is reflected in the substantial cellular pleomorphism and nuclear atypia observed across the tumor. No DCIS lesions are visible. There is no evidence of necrosis, and the TIL score of 50% indicates a moderate immune response. The stroma exhibits a prominent desmoplastic reaction, with fibroblasts actively contributing to the fibrous matrix. Vascular structures are intact and well-formed, with no signs of abnormal angiogenesis. In comparison, Figure 5 (GROUP3-MTCH1-A), MTCH1 expression is absent; this reduced MTCH1 expression is consistent with the aggressive behavior of TNBC, where mitochondrial adaptations promote tumor growth and resistance to apoptosis. The fibroblasts and vascular structures are stable and unchanged compared to the VDAC2-stained section. The TIL score of 50%, reflects a moderate immune response, which may play a role in slowing tumor progression but may not be enough to control tumor growth fully. Figure 5 (GROUP3-VDAC2-B): This section reveals strong VDAC2 expression, with robust cytoplasmic staining across the invasive tumor cells. The staining highlights the high mitochondrial activity typical of triple-negative IDC. The Nottingham grade of 3 corresponds with the significant nuclear pleomorphism and cellular atypia observed. Adipose tissue is not visible in this section, and the tumor seems confined to areas of dense stroma, with no evidence of local invasion into fat-rich regions. The stroma exhibits a moderate desmoplastic reaction, with fibroblasts contributing to the fibrous matrix. Vascular structures are present but unremarkable, showing no signs of increased angiogenesis. The TIL score of 50%, indicating a moderate immune response in the tumor microenvironment, which could play a role in tumor progression. No DCIS lesions are noted. In Figure 5 (GROUP3-MTCH1-B), MTCH1 expression is present, weak to moderate compared to VDAC2 expression, with diffuse yet faint cytoplasmic staining observed in the tumor cells. This reduction in MTCH1 expression is typical of TNBC, where mitochondrial dynamics shift to favor tumor survival and resistance to apoptosis. The stromal and vascular structures appear similar to those in the VDAC2-stained section. The TIL score remains at 50%, reflecting a moderate immune response that suggests active interaction between the immune system and the tumor. However, the effectiveness of this immune response in halting tumor progression remains uncertain. No fatty tissue is visible in this section. Figure 5 (GROUP3-VDAC2-C]: This section shows strong VDAC2 expression, with solid cytoplasmic staining throughout the tumor cells, reflecting active mitochondrial involvement. The staining pattern is typical of triple-negative IDC, suggesting that mitochondrial function is critical in the tumor’s metabolism and survival. The Nottingham grade 3, characterized by significant nuclear pleomorphism and cellular atypia, is consistent with the aggressive nature of the cancer. There is no evidence of fatty tissue in this section, and the tumor appears localized within a dense stromal environment. The stroma shows high fibroblastic activity, contributing to the desmoplastic reaction, with some well-preserved vascular structures visible throughout. The TIL score is high at 65%, indicating a robust immune response, which may influence tumor progression and its interaction with the immune system. No DCIS lesions are present. Figure 5 (GROUP3-MTCH1-C): MTCH1 expression is significantly weaker than VDAC2, with only minimal cytoplasmic staining observed. This reduction in MTCH1 expression is typical of the aggressive behavior seen in TNBC, where mitochondrial dynamics often shift toward survival mechanisms over apoptosis regulation. The weak MTCH1 expression suggests a diminished role of mitochondrial carrier proteins in regulating apoptosis within the tumor. The fibroblastic stroma and vascular structures are consistent with what is observed in the VDAC2-stained section. The TILs are prominent, supporting the 65% TIL score and suggesting an ongoing immune response within the tumor microenvironment. As with the VDAC2 section, no adipose tissue is present. Figure 5 (GROUP3-VDAC2-D): The tumor cells exhibit intense granulating cytoplasmic staining for VDAC2, indicating a solid mitochondrial presence within them. The tumor displays poorly differentiated ductal carcinoma characteristics, with high nuclear pleomorphism, oversized and irregular nuclei, and a diffuse pattern of invasion. No areas of necrosis are observed, which is consistent with the case description. The tumor is assigned an overall Nottingham grade of 3, reflecting tubular grade 3, nuclear grade 3, and mitosis grade 3, corresponding to its aggressive nature. The TILs are present at a moderate level, with a score of 55%, suggesting an intermediate immune response. There is no evidence of fatty tissue or large vascular structures in this image, but the dense arrangement of tumor cells suggests aggressive stromal invasion. However, in Figure 5 (GROUP3-MTCH1-D), MTCH1 expression is notably weak, with only mild cytoplasmic staining visible. This suggests lower mitochondrial apoptotic regulation, potentially contributing to the tumor’s aggressive phenotype. The tumor architecture shows poorly formed tubules and diffuse cellular infiltration. The moderate TIL score remains consistent, indicating some level of immune response. No necrosis, fatty invasion, or prominent vascular structures are observed in this section, although stromal fibroblasts are visible at the tumor’s edges.
Group 4: Protein expression in Nottingham grade 3 TNBC tissues with low TILs percentage
Figure 5 (GROUP4-VDAC2-A): This section shows moderate to strong VDAC2 expression. The strength of the cytoplasmic staining appears due to the accumulation of VDAC2 protein at perinuclear localization. The high VDAC2 protein expression suggests that mitochondrial activity plays a vital role in the metabolic processes of this triple-negative IDC. The tumor size is significant at 95 mm, with a Nottingham grade of 3, reflecting a highly aggressive tumor characterized by a tubular grade of 3, nuclear grade of 3, and a relatively lower mitosis grade of 2. These features indicate significant nuclear pleomorphism but a less rapid proliferation rate. Adipose tissue is visible between the tumor nests, suggesting the tumor has invaded fatty regions. The stroma shows moderate fibroblastic activity, and vascular structures are present but unremarkable. The TIL score is low at 10%, indicating a limited immune response, which may favor tumor progression. In Figure 5 (GROUP4-MTCH1-A), MTCH1 expression is low, with minimal cytoplasmic staining observed. This low expression is consistent with the characteristics of TNBC, where mitochondrial apoptotic regulation may be downregulated, allowing tumor cells to evade cell death mechanisms. The weak MTCH1 expression suggests a limited role in apoptosis regulation in this tumor. The fibroblastic stroma and the presence of fatty tissue mirror the findings in the VDAC2-stained section. Vascular structures are present but remain unremarkable. The sparse TILs suggest that the immune system is not heavily involved in controlling tumor growth in this case. Figure 5 (GROUP4-VDAC2-B): This section reveals strong VDAC2 protein expression. This case showed the most robust diffused cytoplasmic protein expression of VDAC2 across all cases investigated with distinct cytoplasmic staining throughout the tumor cells. The staining pattern suggests active mitochondrial involvement in the metabolic processes of this triple-negative IDC. The Nottingham overall grade of 3, with a tubular grade of 3, nuclear grade of 3, and mitosis grade of 2, points to a moderately aggressive tumor with significant nuclear pleomorphism but a relatively lower mitotic index compared to other high-grade tumors. The fibroblastic stroma shows moderate desmoplasia, which may provide structural support for the cancer. Vascular structures are scattered and worth further confirmation for vascular invasion by detecting specific endothelial antigens. There are no significant signs of angiogenesis. The TIL score is low at 10%, indicating a weak immune response, which could allow the tumor to progress unchecked. Figure 5 (GROUP4-MTCH1-B): MTCH1 expression is weak in this section, with only minimal cytoplasmic staining observed. This low level of MTCH1 expression is consistent with TNBC, where apoptotic regulation by mitochondrial pathways is downregulated, favoring tumor growth and survival. The faint MTCH1 staining suggests this protein plays a limited role in apoptosis control in this tumor. The fibroblastic stroma and vascular structures are similar to those in the VDAC2-stained section, and the TIL score remains low at 10%, indicating a minimal immune response. Figure 5 (GROUP4-VDAC2-C): VDAC2 expression is strong in this section, with a granulating cytoplasmic staining pattern visible throughout the tumor cells. This robust staining is typical of triple-negative IDC, emphasizing the crucial role of mitochondrial function in supporting tumor growth and survival. The Nottingham overall grade of 3, with a tubular grade of 3, nuclear grade of 3, and mitosis grade of 2, reflects a moderately aggressive tumor with significant nuclear pleomorphism but a lower mitotic index than other high-grade tumors. Adipose tissue is visible in the stroma, indicating that the tumor has invaded fat-rich areas, a common feature of IDC. The cancer is interspersed with fibroblastic stroma, showing moderate activity contributing to the desmoplastic reaction. The vascular structures are present but unremarkable, with no significant angiogenic activity. The TIL score is low at 10%, indicating a weak immune response within the tumor microenvironment, which could influence the tumor’s progression and response to immune-based therapies. Figure 5 (GROUP4-MTCH1-C): MTCH1 expression is considerably weaker than VDAC2, with only faint cytoplasmic staining observed in the tumor cells. This reduced MTCH1 expression is characteristic of TNBC, where the apoptotic regulatory function of MTCH1 is downregulated, favoring tumor survival mechanisms over-programmed cell death. The fibroblastic stroma and vascular structures are consistent with those in the VDAC2-stained section, and the TIL score remains low at 10%, reflecting a minimal immune response. Adipose tissue is also visible in this section, confirming that the tumor has invaded fat-rich areas. Figure 5 (GROUP4-VDAC2-D): This section reveals intense and evenly distributed VDAC2 expression across the tumor cells, with cytoplasmic staining typical of triple-negative IDC. The tumor’s cellular architecture displays significant pleomorphism, irregular glandular formations, and marked nuclear atypia, all consistent with the high Nottingham grade of 3. Fatty tissue in this section indicates that the tumor is close to or has already invaded surrounding fat-rich areas. The DCIS component is also visible, and VDAC2 expression is detected in these pre-invasive regions, supporting VDAC2’s role in both the early and advanced stages of tumor development. No necrosis is evident, and the TIL score is mild at 30%, reflecting a moderate immune response. The stroma exhibits a significant desmoplastic reaction, with fibroblasts contributing to a dense fibrous matrix. Vascular structures appear intact and well-formed, with no signs of abnormal angiogenesis. The overall tumor microenvironment, with stable stromal and vascular components, supports tumor growth. Figure 5 (GROUP4-MTCH1-D): MTCH1 expression in this section is weak, with minimal cytoplasmic staining observed in the tumor cells. This reduced MTCH1 expression is consistent with the tumor’s aggressive behavior, as low levels of MTCH1 suggest a shift away from apoptosis regulation, promoting tumor survival. This is typical for TNBC, where mitochondrial function shifts to support the tumor’s metabolic needs. Adipose tissue remains prominent, suggesting that the tumor interacts with or invades fat-rich areas, a common occurrence in IDC. The stromal architecture, including fibroblasts and vascular structures, is like what is observed in the VDAC2-stained section, with no significant changes between the two markers. The TIL score of 30% is consistent, reflecting a moderate immune response that may not be sufficient to impact tumor progression significantly.
Discussion
BC remains one of the most prevalent cancers affecting women worldwide, representing a significant health burden due to its high incidence and often aggressive nature.[1] Standard treatments, including chemotherapy with agents, such as DOX, are effective but come with considerable side effects and the potential for drug resistance.[4-6] In recent years, the exploration of medicinal plant products as adjunct therapies has gained momentum in cancer research. Compounds derived from plants offer a unique promise in cancer treatment due to their diverse bioactive properties, including anti-inflammatory, antioxidant, and anticancer effects. Therefore, in this study, we explore the possible role of AVC in augmenting the conventional chemotherapy side effects of DOX. AVs are hydroxycinnamoyl-anthranilate alkaloids isolated exclusively in oats containing more than 25 polyphenols. AVs have anti-inflammatory, antioxidant, and cancer-fighting effects.[9,10] AVC suppressed cyclooxygenase 2 synthesis in non-small cell lung cancer and prevented lung inflammation under hypoxia.[20] Our findings show AVC has a notable anti-cancer action in MCF-7 BC cells compared to HCT-116 colon cancer. AVC’s IC50 in MCF-7 and HCT-116 was 2.8 and 2.2 times lower than in HepG2 liver cancer cells. Although the anticancer activity of DOX in MCF-7 cells is lower than HCT-116 and HepG2, when combined with varying concentrations of AVC, MCF-7 shows the lowest IC50. In MCF-7 cells, the combination of DOX with AVC resulted in an IC50 approximately half as low as DOX alone. Specifically, DOX dosages of 0.68 μg/mL (1.25 μM) and 0.62 μg/mL (1.14 μM) decreased the viability of MCF-7 and HepG2 cells by 50%, respectively.[21,22]
In MCF-7 cells treated with 3 μM DOX combined with 160 μM AVC, apoptosis was higher than those treated with the lower dose. Apoptosis was also observed to occur earlier in MCF-7 cells treated with both dosages of DOX mixed with AVC than in cells treated only with DOX. Early apoptosis was observed in MCF-7 cells treated with 3 μg/mL (5.5 μM DOX) and labeled with FITC Annexin V.[23] AVC alone caused no apoptosis in MCF-7 cells. However, the natural product Robustaflavone A (RF-A) caused 4% apoptosis and elevated VDAC2 expression in MCF-7 cells.[24] In colon cancer HCT-116 cells, AVC did not trigger apoptosis, while dihydroavenathramide caused apoptosis at 200 μM.[25] DOX triggers the generation of free radicals, which can harm the respiratory chain complexes in the mitochondria. These free radicals also interfere with the sodium-potassium pump membrane and the distribution of calcium ions, ultimately leading to DNA damage and alterations in cell morphology. DOX attaches to the proteasome in the cytoplasm, allowing it to enter the nucleus through nuclear pores. Once inside the nucleus of cancer cells, DOX intercalates with their DNA to deactivate topoisomerase II, preventing the formation of tertiary DNA structures. It also induces cell death by deactivating poly ADP-ribose polymerase 1, p53, and AMPK and intercalating DNA with deoxyguanosine and cytidine.[23,24,26] A study observed that treating MCF-7 cells with 1.5 or 3 μM DOX led to a six-fold reduction in Ki-67 gene expression. When the cells were subjected to both DOX and AVC, the decrease in Ki-67 gene expression was similar at 2.9- and 2.53-fold. Furthermore, MCF-7 cells treated with 3 μM DOX in combination with 160 μM AVC exhibited a 4.8- and 15-fold increase in MTCH1 and VDAC2 gene expression, respectively, compared to cells treated with 3 μM DOX alone (which showed 2.57 and 8.61-fold increases, respectively). In DOX-treated human embryonic (HEK293T) kidney cells, levels of MTCH1 increased, leading to the activation of the protease membrane, which resulted in apoptosis and DNA damage.[27] MTCH1 has two widely expressed isoforms lacking proapoptotic Bax and Bak proteins. Both isoforms are integral external mitochondrial membrane proteins with two proapoptotic domains capable of triggering cell apoptosis when overexpressed. Furthermore, MTCH1 reduced the antiapoptotic actions of Bcl-2 through its interaction with Bcl-2.[27,28] Conversely, when Bax and Bak, proteins found in the outer mitochondrial membrane, combine with the VDAC2 anion channel, it becomes activated and promotes tumor suppression. Once activated, VDAC2 forms pores, which allow cytochrome c to be released. This sets off the activation of procaspase-3, initiating a series of events leading to intrinsic apoptosis.[29] Furthermore, BCl2-xS interacts with VDAC2, releasing Bak from the outer mitochondrial membrane and activating caspase 8. Caspase 8 subsequently cleaves procaspase-3 into caspase-3, resulting in apoptosis.[30]
Little is known about the molecular axis between VDAC2 and MTCH1 in modulating apoptosis and tumor development in invasive BC. The current study explores the synergistic effects of DOX and AVC on the gene expressions of VDAC2 and MTCH1 and apoptosis in TNBC cells. This investigation is significant due to the complexity of treating TNBC, which lacks targeted hormonal therapies and often relies on conventional chemotherapeutics such as DOX. Despite its efficacy, DOX has well-documented toxic side effects that necessitate innovative approaches to mitigate its impact while enhancing therapeutic outcomes.[6] The results of this study demonstrate that combining DOX with AVC can potentiate anticancer effects by altering key mitochondrial pathways. VDAC2 is essential in mitochondrial-mediated apoptosis, acting as a cytochrome c release channel, activating the caspase cascade and leading to cell death.[13,31] Our study findings revealed that VDAC2 expression was markedly increased in MCF-7 cells treated with the combination of DOX and AVC, significantly more than with DOX alone. Specifically, VDAC2 gene expression increased 15-fold in cells treated with 3 μM DOX and 160 μM AVC compared to an 8.61-fold increase with DOX alone. This suggests that the combination therapy setup involving AVC could enhance mitochondrial permeability and apoptotic signaling, contributing to higher apoptosis rates with lower DOX doses and avoiding the harmful effects of chemotherapy.[32,33] Conversely, MTCH1, known for its regulatory role in mitochondrial dynamics and apoptosis, showed a more modest response. The weak or absent expression of MTCH1, as demonstrated in the IHC analysis, aligns with findings that reduced MTCH1 levels can contribute to tumor survival by minimizing apoptotic regulation.[27] The minimal MTCH1 expression in TNBC tissue further highlights the disease’s aggressive nature, where cancer cells often downregulate mitochondrial carrier proteins to favor proliferation over apoptosis.[12]
Interestingly, this study’s IHC results demonstrated consistent patterns across TNBC samples: VDAC2 exhibited intense cytoplasmic staining, suggesting active mitochondrial involvement in metabolic functions and tumor progression. VDAC2 functions as a channel in the mitochondrial membrane that interacts with pro-apoptotic proteins, such as Bax, which is central to initiating apoptosis. A previous study discussed how VDAC2 enables Bax to mediate apoptosis in controversial ways.[29] VDAC2 could play dual roles in mediating apoptosis through its metabolite-transporting biological processes. The elevation of cellular apoptosis in the MCF-7 cell line and the upregulation of VDAC2 under synergistic treatment effects by DOX/AVC could indicate altering VDAC2 apoptosis-mediated pathways. The latter statement could spotlight the possible explanation of the persistence of VDAC2 strong granulating protein expression across all stained tissues and infer the positive correlation between upregulated VDAC2 and the higher energy demands and adaptive mechanisms cancer cells use to sustain rapid growth and avoid apoptosis. On the other hand, MTCH1’s reduced staining in most tissue specimens implies that apoptotic pathways regulated by this protein are suppressed, possibly allowing cancer cells to evade programmed cell death. This aligns with the observation of the functional study where DOX combined with AVC enhances VDAC2 activity but leaves MTCH1 expression largely unaltered.
The gene expression findings corroborate our hypothesis for the roles of the VDAC2/MTCH1 axis in modulating apoptosis. Cells treated with 3 μM DOX and 160 μM AVC showed significant apoptosis rates, up to 76%, compared to treatment with DOX alone. This suggests a robust synergistic effect that promotes apoptotic pathways through VDAC2 modulation. The elevated apoptosis in these cells points to the potential of AVC to enhance DOX’s therapeutic efficacy by promoting mitochondrial dysfunction and cytochrome c release.[32,34]
Conclusion
The current study showed that the combination of AVC and DOX has demonstrated promising efficacy in BC treatment by enhancing apoptotic responses in MCF-7 cells while reducing the side effects of DOX. This synergy decreases chromatin nucleoprotein charge and Ki-67 expression while increasing VDAC2 and MTCH1 levels, leading to higher mitochondrial permeability, cytochrome c release, and caspase-3 activation. These findings suggest that AVC can enhance chemotherapy efficacy by leveraging its antioxidant and anti-inflammatory properties. Further studies in preclinical models and various BC molecular subtypes are recommended to explore the clinical relevance of this combination, potentially leading to more effective and less toxic cancer therapies.
Ethical Approval and Consent to Participate
Ethical approval for the study was obtained from the Unit of Biomedical Ethics at the Faculty of Medicine, King Abdulaziz University, Jeddah, Saudi Arabia, under reference number 256-21. All study subjects agreed to participate in this study and signed informed consent.
Availability of Data and Materials
The data sets used in this study are available from the corresponding author and will be provided upon reasonable request.
Competing Interests
The authors have no conflict of interest to declare.
Funding Statement
The Deanship of Scientific Research (DSR) at King Abdulaziz University, Jeddah, supported and funded this project with grant no (G: 817-130-1441).
Author’s Contributions
Prof. Ehab M. M. Ali and Dr. Sultan N. Sonbul designed and supervised the project. Prof. Ehab M. M. Ali and Eman A. Almuhaini performed the in vitro experiments. Prof. Ayat B. Al-Ghafari and Dr. Sultan N. Sonbul performed an IHC experiment, analyzed the protein expression patterns, and validated the statistical analysis and the final draft of the manuscript. All authors contributed to writing, reviewing, and agreeing to submit the manuscript.
Acknowledgment
The Deanship of Scientific Research (DSR) at King Abdulaziz University, Jeddah, supported and funded this project with grant no (G: 817-130-1441). As a result, the authors express their gratitude and thanks to DSR for its technical and financial assistance.
References
- Tracking the epidemiological trends of female breast cancer in Saudi Arabia since 1990 and forecasting future statistics using global burden of disease data, time-series analysis. BMC Public Health. 2024;24:1953.
- [Google Scholar]
- Breast cancer:Major risk factors and recent developments in treatment. Asian Pac J Cancer Prev. 2014;15:3353-8.
- [Google Scholar]
- Breast cancer:An overview of current therapeutic strategies, challenge, and perspectives. Breast Cancer (Dove Med Press). 2023;15:721-30.
- [Google Scholar]
- Mechanisms of multidrug resistance in cancer chemotherapy. Int J Mol Sci. 2020;21:3233.
- [Google Scholar]
- New insights into the activities and toxicities of the old anticancer drug doxorubicin. FEBS J. 2021;288:6095-111.
- [Google Scholar]
- Doxorubicin-an agent with multiple mechanisms of anticancer activity. Cells. 2023;12:659.
- [Google Scholar]
- Role of plant secondary metabolites in defence and transcriptional regulation in response to biotic stress. Plant Stress. 2023;8:100154.
- [Google Scholar]
- Phenolic amides (avenanthramides) in oats- an update review. Bioengineered. 2024;15:2305029.
- [Google Scholar]
- In vitro study on the effect of doxorubicin on the proliferation markers MCM3 and Ki-67. J BUON. 2013;18:1062-8.
- [Google Scholar]
- Two isoforms of PSAP/MTCH1 share two proapoptotic domains and multiple internal signals for import into the mitochondrial outer membrane. Am J Physiol Cell Physiol. 2007;293:C1347-61.
- [Google Scholar]
- Essential role of voltage-dependent anion channel in various forms of apoptosis in mammalian cells. J Cell Biol. 2001;152:237-50.
- [Google Scholar]
- Methotrexate loaded on magnetite iron nanoparticles coated with chitosan:Biosynthesis, characterization, and impact on human breast cancer MCF-7 cell line. Int J Biol Macromol. 2018;120:1170-80.
- [Google Scholar]
- Influence of Sutherlandia frutescens extracts on cell numbers, morphology and gene expression in MCF-7 cells. J Ethnopharmacol. 2007;112:312-8.
- [Google Scholar]
- DR5-mediated DISC controls caspase-8 cleavage and initiation of apoptosis in human glioblastomas. J Cell Mol Med. 2010;14:1303-17.
- [Google Scholar]
- Regulation of WNT3 and WNT3A mRNAs in human cancer cell lines NT2, MCF-7, and MKN45. Int J Oncol. 2002;20:373-7.
- [Google Scholar]
- Evaluation of imatinib mesylate (Gleevec) on KAI1/CD82 gene expression in breast cancer MCF-7 cells using quantitative real-time PCR. Asian Pac J Trop Biomed. 2016;6:159-63.
- [Google Scholar]
- Avenanthramide C suppresses hypoxia-induced cyclooxygenase-2 expression through sirtuin1 activation in non-small-cell lung cancer cells. Anim Cells Syst (Seoul). 2020;24:79-83.
- [Google Scholar]
- Liver cancer cell lines treated with doxorubicin under normoxia and hypoxia:Cell viability and oncologic protein profile. Cancers (Basel). 2019;11:1024.
- [Google Scholar]
- Doxorubicin induces drug resistance and expression of the novel CD44st via NF-kB in human breast cancer MCF-7 cells. Oncol Rep. 2014;31:2735-42.
- [Google Scholar]
- Doxorubicin-conjugated dexamethasone induced MCF-7 apoptosis without entering the nucleus and able to overcome MDR-1-induced resistance. Drug Des Devel Ther. 2018;12:2361-9.
- [Google Scholar]
- Identification of a new natural biflavonoids against breast cancer cells induced ferroptosis via the mitochondrial pathway. Bioorg Chem. 2021;109:104744.
- [Google Scholar]
- Oat avenanthramide-C (2c) is biotransformed by mice and the human microbiota into bioactive metabolites. J Nutr. 2015;145:239-45.
- [Google Scholar]
- The role of membranes in the mechanism of action of the antineoplastic agent adriamycin. Spin-labeling studies with chronically hypoxic and drug-resistant tumor cells. J Biol Chem. 1983;258:339-43.
- [Google Scholar]
- Early growth response 1 (EGR-1) is a transcriptional regulator of mitochondrial carrier homolog 1 (MTCH 1)/presenilin 1-associated protein (PSAP) Gene. 2016;578:52-62.
- [Google Scholar]
- Expression and putative role of mitochondrial transport proteins in cancer. Biochim Biophys Acta Bioenerg. 2017;1858:641-54.
- [Google Scholar]
- VDAC2 enables BAX to mediate apoptosis and limit tumor development. Nat Commun. 2018;9:4976.
- [Google Scholar]
- Disruption of the VDAC2-Bak interaction by Bcl-x(S) mediates efficient induction of apoptosis in melanoma cells. Cell Death Differ. 2012;19:1928-38.
- [Google Scholar]
- Avenanthramide-C reduces the viability of MDA-MB-231 breast cancer cells through an apoptotic mechanism. Cancer Cell Int. 2017;17:93.
- [Google Scholar]
- Doxorubicin:An update on anticancer molecular action, toxicity and novel drug delivery systems. J Pharm Pharmacol. 2013;65:157-70.
- [Google Scholar]
- Antiproliferative activity of vitexin-2-O-xyloside and avenanthramides on CaCo-2 and HepG2 cancer cells occurs through apoptosis induction and reduction of pro-survival mechanisms. Eur J Nutr. 2018;57:1381-95.
- [Google Scholar]